在集成的工作环境中用创新的谱图数据分析法和NNM的多变量分析进行生物标志物鉴定
会议Poster
Biomarker Identification Combining Multivariate Analysis of NMR Spectra with an Innovative Spectral Data Analysis Approach
in an Integrated Working Environment
Abstract
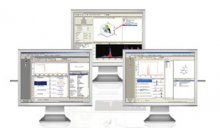
An integrated informatics solution, compatible with multiple instrument formats, covering the full range of steps from raw data processing to biomarker identification, has been long-anticipated by researchers performing metabonomics studies. Such a solution now exists, and we will demonstrate its successful application to the analysis of 1 H NMR spectra of human serum samples from 37 diabetic and non-diabetic subjects. This integrated informatics approach also includes an innovative patent-pending
spectral Overlap Density Heatmap (ODH) tool. By relating statistical findings to spectral observation in a supervised approach, ODH complements Principal Component Analysis (PCA) and offers meaningful direction for biomarker identification.
The integrated informatics approach to metabolomics research includes the following steps:
• Batch processing of raw FIDs, phasing, baseline correction, and cross-spectral alignment.
• Batch import of the processed spectra.
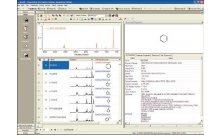
• Include/exclude spectral ranges, optional binning and bucketing, pre-processing, Y-transforms, and PCA.
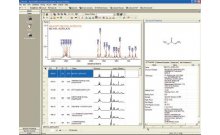
• Visualization as an Overlap Density Heatmap, a novel method to quantitatively evaluate the similarity/dissimilarity among multiple overlaid spectra.
• Comparative use of loadings plots resulting from PCA and peaks resulting from Overlap Density Heatmaps as search queries against a database of known metabolites.
• Link to the KEGG database for metabolic pathways of identified metabolites.
Conclusions
This NMR-based metabolomics study demonstrates the potentials of utilizing a software platform that combines the full range of applications from raw data analysis to biomarker identification in one single environment. The well-established PCA and the novel Overlap Density Heatmap technology provided within the KnowItAll ® Informatics System complete each other for the identification of key metabolites or biomarkers: ODH provides a visualization tool that “talks” to the chemist and allows direct examination of the data, either in a supervised or non-supervised way. Such an advanced tool can help define the best spectrum processing and data pre-processing options, and lead researchers to identify spectrum areas on which to focus in their analyses. PCA, on the other hand, provides easier automation and reproducibility, as well as easier access to time evolutions via the display of trajectories in toxicity studies.