集成的软件环境用于基于NMR的代谢组学分析
会议Poster
An Integrated Software Environment for NMR-Based Metabolomics Data Analysis - Leap to Biomarker Identification from PCA
Introduction
There has been a maturation in computer technologies that convert the instrumental measurements of patient samples to a collection of spectra and then prepare the spectra for sophisticated multivariate analysis tools. The next steps, recognition of altered concentrations of metabolites and identification of the affected metabolic pathways, remain a challenge. We have developed two technologies that combined with an integrated informatics system to accomplish this critical step.
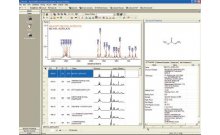
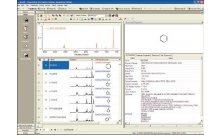
Using this integrated informatics approach, raw NMR spectra are processed, and the processed NMR spectra are transferred to an integrated chemometrics data analysis tool. The outcome is a Principal Component Analysis (PCA) of the spectra, which includes a graphical display called a Scores Plot. In the Scores Plot, each NMR spectrum from a metabolomics experiment is represented as a single point in the plot. Similar spectra will appear nearer to one another in a Scores Plot, and dissimilar spectra will appear further away from one another. A related diagnostic graphical display called a Loadings Plot indicates the regions of the NMR spectra that describe the most variance in the NMR data set. The Scores Plot is related to the Loadings Plot in that the Loadings Plot describes the spectral regions that are highly variable in the experimental samples and therefore where in the Scores Plot each point will appear.
A Loadings Plot can be used as a query to search a reference metabolite database to identify a list of putative metabolites whose concentration is changing throughout the course of the experiment. Alternatively, the reference metabolite database can be projected into the same space as the PCA Loadings Plot and filtered to identify the putative metabolites visually in the Loadings Plot. In this second approach, the list of filtered metabolites can be used to create a rank-ordered list of putative biological
pathways based on the co-occurrence of the filtered metabolites in each pathway. Direct internet links from the rank-ordered list to the KEGG database allow the researcher to explore each pathway in more detail.
Conclusion
It is important to obtain a PCA where classes of samples are clearly separable. The subsequent peak search or database projection are viable methods to discover compounds which contribute to the class separation. This system completes the steps to go from a PCA to biomarker(s) identification and finally, to suggest the possible metabolic pathways.