检查红外谱库搜索结果中的数据分辨率效应
Examination of the Effect of Data Resolution on IR Spectral Database Search Results
Background
The pursuit of better search results has inspired innovation after innovation in the field of spectroscopy. It is commonly accepted that higher resolution of both reference databases and query spectra offer better comparison results for identification [1] . In the mid 1960’s, Sadtler’s original Spec-Finder product encoded up to 13 peaks at 11 intensity levels. Punch card limitations and computing power restricted options. Today, technological advances have changed disk space and computational time limitations of computer search methods even from the more recent past.
Storage space was a very significant concern only a decade ago. Hard disk drives averaged 10 GB or less, and storing and searching Sadtler’s databases in high resolution would have been a strain. However, 4 to 8 GB of high-resolution data will not stress even the lowest end computer on the market today. The average storage cost per gigabyte has dropped from over $10 to less than $0.10 over the same period [2] .
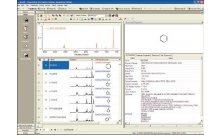
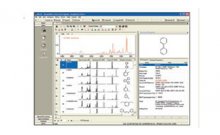
Computing power has also seen massive improvements. In the not too distant past, searching hundreds of thousands of spectra required nearly half an hour. Today’s multi-core processors with a multi-threaded application like Bio-Rad’s KnowItAll Informatics System [3] can perform the same task in only a few seconds. While storage cost has decreased by a factor of 100 in the last decade, the average computer’s computational cost has decreased by a factor of more than 1,000.
Resolution
Confusion occasionally occurs when discussing resolution because the term is loosely interchanged with the data point spacing of a spectrum. Resolution defines the minimum distinguishable, closely spaced peaks. Since a peak requires three data points to be distinguished, the resolution is actually twice the data point spacing of the spectrum. In a spectrum with 0.96 cm -1 data point spacing, any peaks that are at least 1.92 cm -1 (its resolution) apart can be distinguished.
The relationship of resolution to valuable information that can be extracted from a spectrum is almost linear. There is a point of diminishing returns that may be different depending on the application. The difference between a 32 cm -1 data point spaced spectrum and a 1 cm -1 data point spaced spectrum is visually apparent, so the perceived value is significant. The differences between a 4 cm -1 data point-spaced spectrum and 1 cm -1 data point-spaced spectrum are not visually evident. However, mathematically the differences can be observed and the impact on search results traced.
Conclusion
Altering an original spectrum’s resolution has a significant impact on spectral comparison search results. Resolution changes do not need to be visually obvious to influence search results. Simply changing from 0.96 cm -1 to 4 cm -1 data point spacing will alter the top three results in as many as one out of every five searches.
There is a point of diminishing returns with respect to how high the resolution must be for any specific project. Changes in the top three search results are not significant when the correct compound is in the database. A well-run query spectrum can identify an exact match at very low resolutions with most comparison algorithms [5] . However, when a match is not in the database, interpreting results becomes an issue.
Some software is designed only to display or analyze the top few results from spectral comparisons. Industry best practices recommend identifying separation in search result quality indices to aide in classification. Any resolution degradation clearly has some level of impact on quality index separation between search results.


