

| Signal-to-Noise Ratio | >30,000:1 RMS (>15,000:1 FSD) |
| Data Acquisition Rate | 1,000,000 points/sec. to 1 point/1000 sec. |
| Inputs | 4 photon counting (TTL); 4 analog (+/- 10 volts); 1 analog reference channel(+/- 10 volts); 2 TTL |
| Outputs | 2 analog (+/- 10 volts); 2 TTL |
| Emission Range | 185 nm to 900 nm (optional to 5,500 nm) |
| Light Source | High efficiency “ECO” friendly continuous 75 W Xenon arc lamp(Optional 450 W Xenon) |
| Monochromator | 300 mm, triple grating, coma-aberration corrected, asymmetrical, excitation or emission optimized, Czerny-Turner design |
| Slits | Computer controlled, continuously adjustable |
| Excitation Grating | 1200 line/mm 300 nm blaze, (Up to two optional gratings can be ordered) |
| Emission Grating | 1200 line/mm 400 nm blaze, (Up to two optional gratings can be ordered) |
| Wavelength Accuracy | +/- 0.3 nm |
| Minimum Step Size | 0.022 nm |
| Standard Detection | Multimode: Photon Counting, 3 analog (fast, medium, slow response), direct and Single-Shot Transient Digitizer (SSTD) mode, and Time-Correlated Single Photon Counting (TCSPC) |
| System Control | Computer interface with FelixGX spectroscopy software |
| Lifetime Range | 5 ps to seconds with appropriate time-resolved accessories |
| Dimensions (W x D x H) | 36 in x 28 in x 12 in (QM-8075-11) |
PTI QuantaMaster System Specifications*
PTI QuantaMaster 8000 | PTI QuantaMaster 300 Series | PTI QuantaMaster 800 | |
|---|---|---|---|
Signal to Noise Ratio | 30,000:1 or better | 300: 1500:1 or better | 6000:1 or better |
Data Acquisition Rate | 1,000,000 points/sec. to | 300/300 Plus: 1 point/sec to | 1,000,000 points/sec. |
Inputs | 4 photon counting (TTL); 4 analog (+/- 10 volts) ; 1 analog reference channel (+/- 10 volts); 2 TTL | ||
Outputs | 2 analog (+/- 10 volts) 2 TTL | ||
Emission Range | 185 nm to 900 nm | 185 to 680 nm | 185 to 680 nm |
Light Source | High efficiency “ECO” friendly | 300/300 plus: High power | High efficiency “ECO” friendly |
Monochromator | Coma-aberration corrected, asymmetrical, excitation or emission optimized, Czerny-Turner design | ||
Focal Length | 350 mm | 350 mm | 150 mm excitation |
Slits | Computer controlled, | Manual or computer | Manual continues Excitation, |
Emission Grating | 1200 line/mm 400 nm blaze | 1200 line/mm 400 nm blaze | 1200 line/mm 400 nm blaze |
Optional Grating | 75 to 2400 line/mm and holographic models available | ||
Wavelength | +/- 0.3 nm | +/- 0.3 nm | +/- 0.05 nm excitation |
Minimum Step Size1 | 0.01 nm | 0.01 nm | 0.05 nm excitation |
Lifetime Range | N/A | 1 μs to seconds | N/A |
Detection | Multimode: Photon Counting, 3 analog (fast, medium, slow response), direct and Single-Shot | ||
System Control | Computer interface with spectroscopy software | ||
*Components, dimensions and specifications vary depending on the specific QuantaMaster configuration and accessories selected.
1Dependent on grating selected
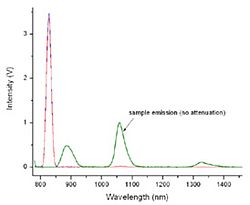
Fluorescence Upconversion
Upconversion phenomena in lanthanide-doped glasses and powders has been extensively studied in recent years. They are of interest due to a demand for compact and efficient lasers and amplifiers for optical communications, especially
The upconversion setup allows for simple determination of the luminescence upconversion quantum yields due to an efficient and ergonomicallydesigned integrating sphere (shown with the top removed) with easy access to the sample
Electroluminescence and Photovoltaic Measurements
The flexibility of the modular design makes it easy to utilize the PTI QuantaMaster for more specialized applications, such as electroluminescence or photovoltaic measurement. Here, the figure shows an electrical response of a photovoltaic cell illuminated with the PTI QuantaMaster excitation monochromator equipped with an NIR grating. The electrical signal from the cell is fed directly to one of the analog inputs of our versatile ASOC-10 interface, and the powerful PTI FelixGX software takes care of rest!
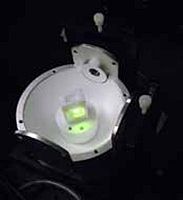
Emission generated by applying different voltages (6V and 9V) to a thin film electroluminescent sample using the PTI QuantaMaster with the electroluminescence accessory.
Quantum Yield
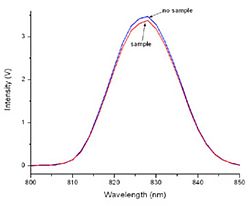
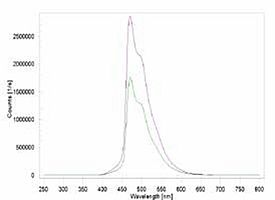
Quantum Yield determination of Nd3+ doped glass in NIR with the integrating sphere and InGaAs detector. The measurement requires high signal stability and precise emission corrections. The QY experiment involves emission scanning over the excitation peak, which is usually significantly higher than the emission spectrum. Since the absorbance of the sample is very low, an excellent signal stability, high dynamic range and a linear behavior of the detector are of utmost importance for accurate QY determination. The graph on the right shows the expanded excitation peak with, and without, the sample. Capturing the difference of the two signals is the key to accuracy. The triplicate experiment showed excellent reproducibility resulting in QY = 0.567 ± 0.017.
Applications and Examples: NIR Fluorescence Spectroscopy
The applications and interest in NIR photoluminescence have been growing rapidly in recent years. This trend is spearheaded mostly by extensive research in nanotechnology and materials science. NIR-emitting nanoparticles, lanthanide doped glasses and ceramics used in developing new laser media and photonic devices, single-walled carbon nanotubes, semiconductor and electroluminescent systems are only a few dominant applications. There is also a considerable research effort in the optical fiber communication industry to develop infrared molecular amplifiers for the transmittance window at 1550 nm. In biomedical areas, there is a trend of using NIR-emitting nanoparticles as luminescent markers due to the fact that the light scattering, a notorious problem in UV-VIS fluorescence measurements, is greatly reduced as the wavelength increases. Less interference means better signal to noise with strongly scattering biological samples. NIR light can penetrate tissue at a much greater depth than the UV and VIS— a definite advantage in tissue imaging and therapeutic applications. In photobiology, the detection of singlet oxygen and development of efficient photo sensitizers for PDT has been the dominant application for years. The continuing introduction of new NIR emitters, coupled with better detection and lower cost systems continues to fuel the growth of NIR luminescence applications. PTI offers an extensive line of PTI QuantaMaster NIR photoluminescence systems with a broad range of options and accessories. The detectors offered include both NIR PMTs and solid state photodiodes that span the range of up to 5,500 nm. Most of these detectors can also be used with pulsed light sources, thus providing the lifetime capabilities in NIR.
Applications of NIR Fluorescence
Materials Science
Nanomaterials
Glasses and ceramics
LEDs and lasing media
Semiconductors
Upconverting nanoparticles for tissue imaging
Optical fiber communication
Optical amplifiers (e.g. chelated Er3+, 1540 nm)
Photobiology and photomedicine
Singlet oxygen detection
R&D of singlet oxygen photosensitizers
Photodynamic Therapy (PDT)
Environmental
Photo-oxidation of environmental pollutants
Geology
NIR luminescence of minerals
Forensic science
Identifying forged documents
Photoluminescene of Lanthanides
Many applications using photoluminescence measurements involve rare earth ions (lanthanides), such as Nd3+, Er3+, Tm3+, Ho3+ and Pr3+, which often emit in the NIR. Often these ions are used with ligand photosensitizers which improve their light absorption properties, as lanthanide ions themselves are very weak absorbers. They are used as dopants in lasing media and glasses, and are made into nanoparticles of varying sizes and shapes in order to control their optical properties. The photoluminescence lifetime (from microseconds to milliseconds) is the key parameter in assessing the optical efficiency of devices involving lanthanides, as well as in quality control during their manufacturing.
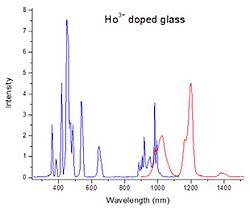
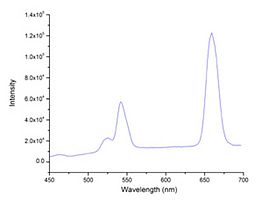
PL emission and excitation spectra of Ho3+ doped glass measured with the PTI QuantaMaster 500, using the TE-cooled inGaAs detector and lock-in amplifier.
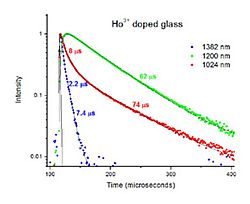
PL decays of Ho3+ doped glass measured with the PTI QuantaMaster 500 system operating in the lifetime mode. Note that the decays are very different for different transitions. The decay at 1200 nm also shows a rise time of 2.4 ?s.
Single Walled Carbon Nanotubes
Single-walled carbon nanotubes have been one of hottest topics in photonics/materials science in the last few years. There are numerous existing and potential applications where SWCNTs are used, such as microdiodes and microtransistors, computing and switching devices, screen displays, gas sensors, biological sensors (NA hybridization), bio-imaging, drug delivery and many others. Mechanically, they are 3 to 10 times stronger than steel and exhibit high thermal and electrical conductivity.
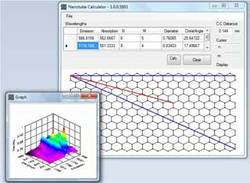
SWCNTs are made of a sheet of graphene rolled along a certain angle (chiral angle) into a tube of diameter r. These structural parameters can be determined by photoluminescence measurements, usually in the NIR range. By collecting a 3D excitation-emission matrix and determining the excitation and emission wavelengths of the 3D PL peaks, the structural parameters, the chiral angle and r, can be calculated. Felix GX provides the Nanotube Calculator which makes this task easy.
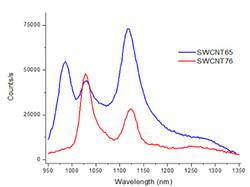
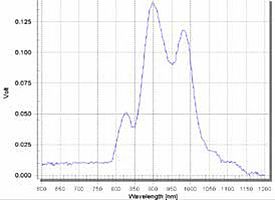
Photoluminescence spectra of two different SWCNTs measured with the PTI QuantaMaster 600 NIR photoluminescence spectrometer. In order to determine the chiral angle ? and the nanotube radius r, a 3-D ExEm matrix needs to be acquired, and the result submitted to the Nanotube Calculator.
Optical Fiber Communications
The use and demand for optical fiber communication has grown rapidly and applications are numerous, ranging from global networks to desktop computers. There have been three spectral ‘windows’ used for optical transmission: 850 nm, 1310 nm and 1550 nm, with the third window now becoming a globally accepted transmission band. There is a need to insert some light amplifiers along the fiber line. One idea of amplifying the signal is based on a chelated Erbium ion. Erbium belongs to the family of lanthanides and has an emission band in the NIR at about 1550 nm, so it matches perfectly the 3rd optical transmission window. The chelating molecules are excited in the UV or VIS by inexpensive LEDs and transfer the excitation energy by FRET to the Erbium center, thus promoting Erbium to its excited state. Since the energy difference between the excited and ground state of Erbium equals the energy of photons (1550 nm) that are propagated along the fiber, these incoming photons will stimulate the emission from Erbium, enhancing the overall signal.
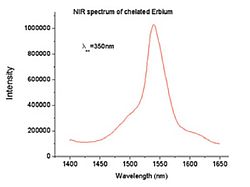
Emission spectrum of chelated Erbium (solid sample) measured with the NIR-PMT and solid sample holder accessory. The system features a thermoelectrically cooled, extended wavelength range NIR PMT operating in the photon counting mode.
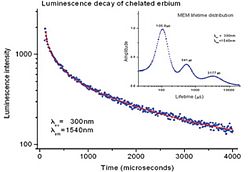
Luminescence decay of chelated Erbium (solid sample) measured with the NIR-PMT system operating in the time-resolved ‘gated’ mode. The decay can be described by a broad tri-modal lifetime distribution, as shown by the MEM distribution analysis—a powerful analysis package from PTI.
Singlet Oxygen Detection
Singlet oxygen generation and detection are growing fields with applications in such areas as cancer treatment, photosensitized oxidations, and biomolecular degradation. The first excited state of an oxygen molecule is a singlet state, which can readily react with other singlet molecules. Radioactive decay to the triplet ground state is a spin forbidden transition resulting in a long lived excited state. Excited singlet oxygen emits phosphorescence in the NIR at 1270 nm.
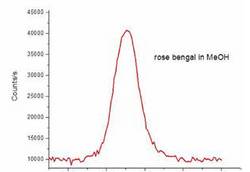
Spectra of singlet oxygen generated by Rose Bengal in methanol
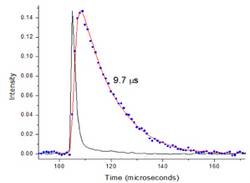
Lifetime of singlet oxygen using a NIR-PMT with the Xe flash lamp. This is a substantial undertaking, considering the singlet oxygen phosphorescence quantum yields are of the order of 10-6


|
除厂家/中国总经销商外,我们找不到 模块化荧光光谱仪 QuantaMaster 8000系列 的一般经销商信息,有可能该产品在中国没有其它经销商。
如果您是,请告诉我们,我们的邮件地址是:sales@antpedia.net 请说明: 1.产品名称 2.公司介绍 3.联系方式 |
售后服务
我会维修/培训/做方法
如果您是一名工程师或者专业维修科学 仪器的服务商,都可参与登记,我们的平台 会为您的服务精确的定位并展示。