合成孔径雷达原理(三)
But for v << c, v2 / c2 approaches 0. Therefore

This frequency is different from the actual frequency emitted from the antenna by the amount

Since the return echo will be shifted by the same amount, the Doppler frequency shift for the target is
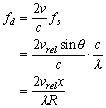
This value provides a means of determining exactly where the echo signal came from. For a return signal detected by the antenna at a time corresponding to the slant range R (t = 2R/c) and with a Doppler frequency shift of fd, the azimuth coordinate must be
 .
.
Even if another target is at range R and within the beam at the same time, measurement of its Doppler frequency shift fd still allows us to associate it with an azimuth coordinate x2. Thus for any target point, we now have two coordinates to localize it--the ground range Rg, relative to the nadir line, and the azimuth distance x2 relative to broadside.
SAR Azimuth Resolution
Utilizing the Doppler effect cannot increase the range resolution but it does greatly increase the azimuth resolution. From the equation for Doppler frequency shift, the azimuth resolution can be calculated as

where  f is
the resolution of the Doppler frequency shift--approximately equal to
the inverse of the time during which the point target was in the beam,
  fd
fd  1 / tspan. This time span can be calculated as

Therefore the azimuth resolution is

which
implies that better resolution is obtained with a smaller antenna--not
what one would expect since this is opposite to the rule for real
aperture radar. This does not mean, of course, that one could simply
build an antenna 1 cm long to obtain a resolution of 5 mm. The length of
the aperture must be large enough to create the proper interference
pattern between the dipoles of the antenna necessary for the desired
beamspread at a particular frequency--  H =
H =  / La.
/ La.
This result of  x = La /
2 is not strictly true, however, since we assumed that a constant
Doppler frequency shift was observed during the entire time tspan. In fact,
  fd changes throughout the observation and is only approximately constant for a time much less than tspan.
A Fourier analysis of the Doppler waveform results in frequency
components at various frequencies so that the target is observed to
spread out over multiple resolution cells, covering a distance greater
than the resolution
  x calculated above.
SAR Azimuth Compression
As the radar beam passes over the point target, as in Figure 7, the slant range to the target varies--decreasing to a minimum and then increasing again. Thus one target traces a hyperbolic line in the azimuth-slant range plane. This hyperbola is known as the range migration curve and the line joining the two ends is known as the rangewalk. Since this hyperbola is representative of only one point, all the points along this curve must be compressed to form a single pixel in the final image. There are several problems involved in this, however. First, the shape of the hyperbolic line depends greatly on the slant range distance to the target when at the centre of the radar beam. Second, the system impulse response changes with slant range. That is, the received signal is sensitive to the time delay, thus requiring different filter parameters to maintain the constant power requirement.
An airborne SAR has an altitude low enough to consider the Earth as a flat surface. The hyperbola will be very flat since the range differences for one target are relatively small. When operating from a satellite, however, the altitude is high enough that the curvature of the Earth becomes a factor, extending the hyperbola. Also, the rotation of the Earth warps it to one side in the range direction. These effects must be corrected before the compression processing can begin.
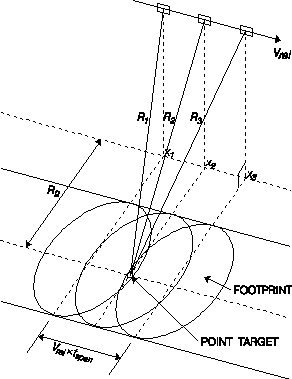
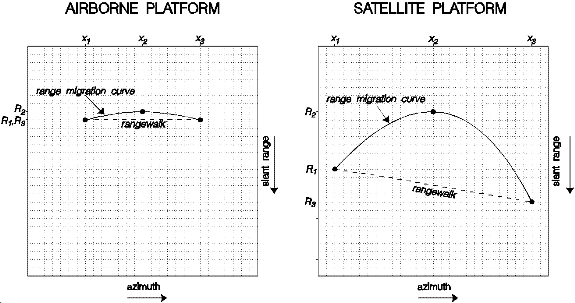
Figure 7. Hyperbolic curve traced by a point target in the azimuth-slant range plane.
When
two waves are not synchronous with each other, they are said to be out
of phase. The phase difference is measured in radians or degrees. For
instance, if the wave A's crest occurs at the same time as wave B's
trough, the phase difference is  (or 180º). Figure 8 illustrates further examples.

Figure 8. Phase differences between two waves.
The phase difference, in radians, between the transmitted and received signal will be

where Figure 9, shows that the range is

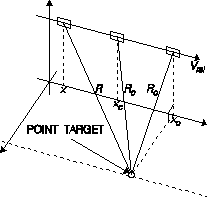
Figure 9. Quadratic relation between range and time for a target within the radar beam.
Using the Taylor series to expand this around the position xc for the slant range Rc gives

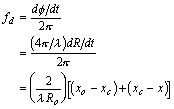
when truncated to the second order. Assuming that Rc and R0 are approximately equal for narrow beam radars, the Doppler frequency shift is
