


Assay of superoxide dismutase activity-2
Cuvette holders in the sample chamber of the spectrophotometer were thermo-controlled at 25°C. For the blank test, 100 ml of 50 mM potassium phosphate buffer (pH 7.8) was added into a cuvette with 0.8 ml of working solution. A suitable concentration of xanthine oxidase was diluted, and 100 ml of it was added into the cuvette to initiate the reaction. A linear curve with a slope of 0.025 absorbance per min in time scan was obtained by adjusting the concentration of xanthine oxidase. The time scan lasted 5 min. The phosphate buffer was then replaced by a serial dilution of a SOD sample to obtain different decreased slopes, and each reaction was performed at least twice. At least three dilutions of a SOD sample were scanned in the defined reaction, one for the maximum competition (i.e., the lowest slope that could be obtained by adding the sample into the reaction), the other two were diluted to approach half of the maximum competition. The slope-sample amount data were then converted to a plot of slope against sample amount. Maximum competition (lowest slope) and a linear curve, including the point for the blank test, were the two elements in the plot. A regression function was obtained for the linear curve. The sample amount corresponding to half of the lowest slope was obtained through interpolating or extrapolating to the regression curve. One unit of SOD activity was defined as the amount of SOD which produced one half of the maximum competition against NBT in the specified system.
Results
The two-step soaking of the gel was followed by illumination. The soaking period, illumination duration, and light intensity were critical factors in developing the negative-stained bands of SOD isozymes. In order to save time while having well developed gels, the time course experiment was carried out for the two soaking steps and the illumination. The results indicated that 15 min for each soaking and illumination for 15 min with a light intensity of 30 mEm-2s-1 for photochemical reaction were suitable for the color development.
The ED scheme was demonstrated with four plant samples. As shown in Figure 1, the readings were proportional to the amount of enzyme preparations, and the curve of the partially purified mungbean SOD was used as a standard. The curve of mungbean SOD is linear below the reading of 1,300. Similar results were obtained for the other three samples, however, with a wider linear range.
Interferences, including possible endogenous SOD inhibitors and agents causing the reduction of NBT in the plant crude extract, could be removed by polyacrylamide gel electrophoresis. One of the interferences coming from non-SOD small molecules was detected as the smears at the bottoms of papaya and tobacco lanes (Figure 2). These
Table 1. Comparison of SOD activities of three plant samples assayed via the electrophoresis-densitometric method (ED scheme) and by the spectrophotometric method.
SOD activity (unit/ml)
Crude extract By ED scheme By the spectrophotometric method
Rice seedlings 2.08 1.19
Papaya leaves 2.48 2.03
Tobacco leaves 1.13 2.02
For each of the three samples, n = 6 on 6 gels assayed via the ED scheme. The readings obtained by densitometry were 1001.5 ± 87.44, 1066.5 ± 68.02, and 820.5 ± 59.39 (mean ± SD) for rice, papaya and tobacco, respectively. In the spectrophotometric method group, the assay was performed twice for each of the samples.
interferences could result in inaccurate readings of SOD activity in the spectrophotometric method. Comparisons of plant SOD activities measured with the ED scheme and the spectrophotometric method are shown in Table 1.
Discussion
SOD activity has been determined spectrophotometrically for over twenty years— ever since its function was first understood (McCord and Fridovich, 1969). Because superoxide radical is unstable, it is difficult to determine the activity of SOD by depending on the dynamic concentration of the substrate. Depending on the product level is also not feasible because hydrogen peroxide is also not stable in the presence of certain metal ions. Catalase and peroxidase existing in the tissue crude extract can also interfere with the result. In this spectrophotometric method, xanthine oxidase and xanthine were used to generate a superoxide radical flux, while cytochrome c functioned as a competitor against SOD on the superoxide radical and as a color indicator. Cytochrome c was later replaced by NBT because the result could be interfered with by some enzymes such as cytochrome oxidase and cytochrome peroxidase existing in the tissue crude extract (Beauchamp and Fridovich, 1971). The method is sensitive, but with some disadvantages. First, it is time-consuming. In eight hours of work, about four samples' SOD activity can be determined (five data points for the plot of slope against sample amount with each data point performed twice). Second, the activity of the diluted xanthine oxidase, which initiates the reaction, decreases during the work time, affecting the precision of the slope data from the time scan. The slope of the blank test in the assay, which measures the superoxide radical flux generated by the xanthine oxidase, is critical to obtaining the activity unit of a SOD sample. The lower the slope, the less the unit. The same effect was assumed to exist in the reactions when SOD samples were scanned. The final disadvantage of the traditional spectrophotometric method is that it cannot exclude possible molecules in the sample extract, which can interfere with the determination of the genuine activity of SOD, contributing to an incorrect estimation of the SOD activity.
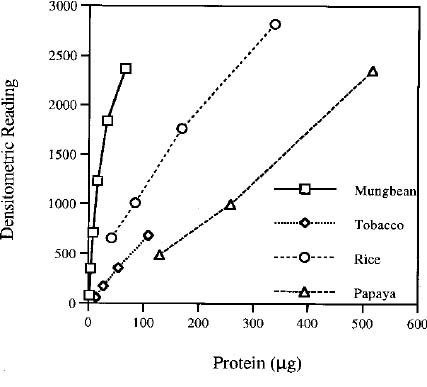 | ||
Figure 1. Curves of densitometric readings corresponding to SOD activity against protein quantities of the four plant samples. The four samples were partially purified mungbean SOD, and crude extracts of rice seedlings, papaya, and tobacco leaves. After electrophoresis and SOD activity staining, the gels were scanned with a laser densitometer. The readings were obtained by processing the images. In the curve of mungbean SOD, for each data point n= 4, 8, 12, 12, 8, and 4 from low to high reading, respectively. All the data points in the curves of rice, papaya, and tobacco were performed four times in four polyacrylamide gels.
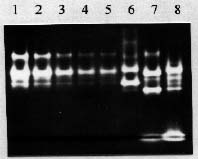 Figure 2. Electrophoresis and negative staining of SOD. Lane 1_5 are serial dilutions of partially purified mungbean SOD. Lane 4 and 5 are duplicated. Lane 6_8 are crude extracts of rice seedlings, papaya leaves, and tobacco leaves, respectively. At the bottom of papaya and tobacco lanes there are different light yellow smears, presumably caused by interference molecules in the crude extracts.
