


Real-space and real-time dynamics of CRISPR-Cas9 visualized by ...(三)
Structural rearrangement of the HNH domain. a, b HS-AFM images of the HNH domain in the high-height (a) and low-height (b)
states. The mean center positions of the HNH and REC1 domains are
indicated by dots. Red and blue lines indicate the cross-sectional
position used for the height distribution analysis in Supplementary
Fig. 5d.
For comparison, the Cas9–RNA–DNA models in the I and D states are shown
below the respective images. The structural models consist of Cas9–RNA
(PDB: 4OO8) and DNA (PDB: 5F9R), and the D state model was built as
described previously17. The scale bars are 5 nm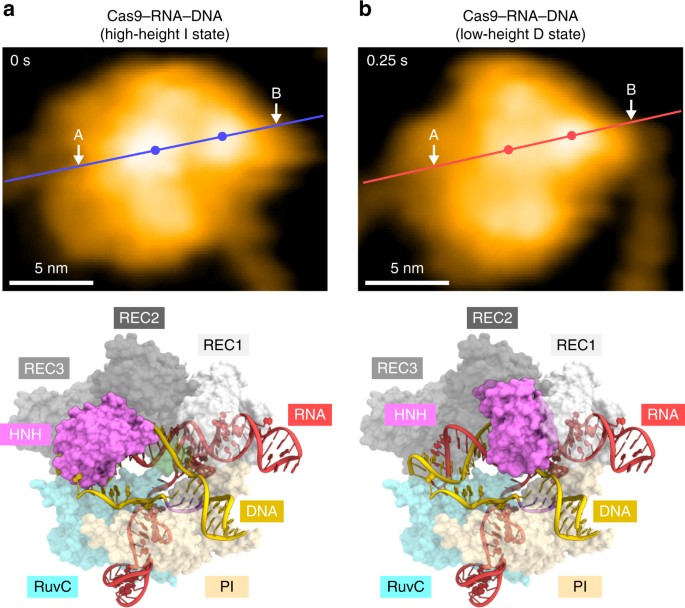
DNA release after cleavage
Our HS-AFM movies revealed that most of the Cas9–RNA molecules remain bound to the PAM-distal region (the non-PAM side) of the cleaved DNA after the release of the PAM-containing region (the PAM side) (104.50 s; Fig. 3a, d, Supplementary Fig. 6a, b, Supplementary Movie 5). The dwell time of the low-height state before the DNA release ranged widely from 0.4 to 29.2 s, whereas previous biochemical experiments showed that Cas9–RNA remains tightly bound to the DNA even after cleavage11,26. This discrepancy suggests that the physical contacts with the AFM probe facilitate the dissociation of Cas9–RNA from the DNA after cleavage. We observed some Cas9–RNA molecules that remained bound to the PAM side of the cleaved DNA after the release of the non-PAM side (Fig. 3d). Although this would require the unwinding of the RNA–DNA heteroduplex, it is unclear how the non-PAM side is released from the complex, due to the limited resolution of the HS-AFM imaging. The release of the non-PAM side was not observed in a previous DNA-curtain assay11, and this discrepancy may also be derived from the effects of the contacts with the AFM probe. The HS-AFM movies showed that the released DNAs on the PAM side are apparently longer by ~ 2.7 nm (n = 14), as compared with those before the release (Supplementary Fig. 6b, c). Given that the 8-bp PAM DNA duplex (0.34 nm/bp × 8 bp = 2.7 nm) is accommodated between the REC1 and PI domains in the crystal structure14 (Supplementary Fig. 6d), this apparent extension of the PAM-side DNA is likely due to the release of the PAM-containing region, which is bound inside the Cas9–RNA molecule before the release.
Target DNA search by Cas9–RNA
Previous DNA-curtain assays11 and single-particle tracking analyses27 suggested that Cas9–RNA interrogates the target sites via three-dimensional diffusion in vitro and in mammalian cells, respectively. Using HS-AFM, we sought to visualize the target interrogation by the Cas9–RNA complex. However, we failed to observe the movement of Cas9–RNA along the DNA, since the strong interactions between Cas9–RNA and the AP-mica surface suppress the free diffusion of the complexes. In contrast, Cas9–RNA can diffuse more freely on a mica-supported lipid bilayer, thus allowing the HS-AFM observations of the Cas9–RNA movement along the DNA. We adsorbed the 600-bp dsDNA containing a 20-nt target site with the TGG PAM on the mica-supported lipid bilayer, and then added apo-Cas9 or the pre-assembled Cas9–RNA complex (Fig. 5a, b). The HS-AFM movies revealed that multiple apo-Cas9 molecules bind and slide along the DNA (Fig. 5a, Supplementary Movie 6). An analysis of the HS-AFM movies confirmed that apo-Cas9 binds to the DNA in a non-specific manner (Fig. 5c, Supplementary Fig. 7a), consistent with the DNA-curtain study11. A time course analysis of the DNA-bound Cas9 positions confirmed that apo-Cas9 slides along the DNA (Fig. 5d). In contrast, the HS-AFM movies revealed that the Cas9–RNA complexes do not slide along the DNA, and rapidly bind to the target site in a specific manner (Fig. 5b, Supplementary Movie 7). An analysis of the HS-AFM images confirmed the specific binding of Cas9–RNA to the target site (Fig. 5c, d, Supplementary Fig. 7b).
HS-AFM observations of target interrogation by Cas9–RNA. a, b Sequential HS-AFM images of the DNA after addition of apo-Cas9 (a) and Cas9–RNA (b) on the lipid bilayer. Apo-Cas9 and Cas9–RNA are indicated by white arrows. The scale bars are 50 nm. c Binding distributions of apo-Cas9 (n = 69) and Cas9–RNA (n = 61). The binding distribution of Cas9–RNA fits a Gaussian curve, with the peak corresponding to the target site. d
Time courses of the binding positions of apo-Cas9 and Cas9–RNA. The
distances from one end of the DNA were measured for five representative
apo-Cas9 (left) and Cas9–RNA (right) molecules. Blue lines indicate the
positions 200 and 400 bp from one end of the DNA (the potential target
sites). Blue arrows indicate the binding of Cas9–RNA to the target site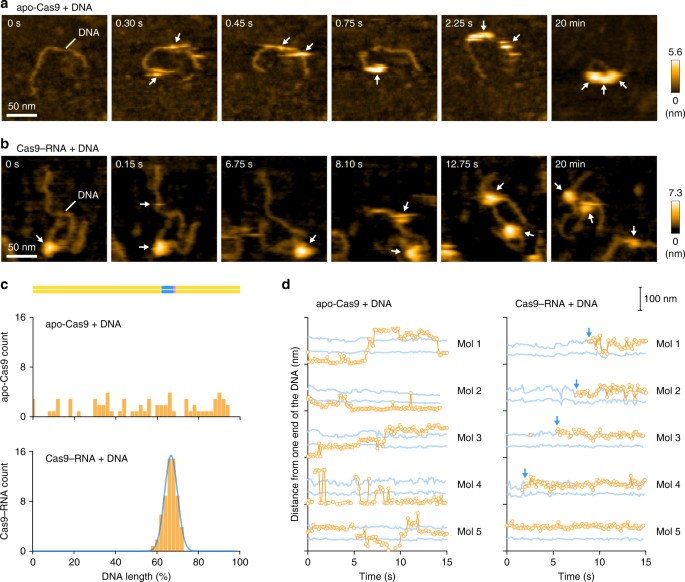
Intriguingly, we observed short-lived bright spots (less than 3 ms) on the DNA (Fig. 6a, Supplementary Movie 8). These spots on the DNA were only observed in the presence of the Cas9–RNA complex, but not in its absence (Fig. 6b–d), suggesting that the observed short-lived spots represent the transient binding of Cas9–RNA to non-target sites. The lifetime of the non-target binding was estimated to be ~1 ms (Fig. 6e). Given that this lifetime is much shorter than the reported value (~3.3 s) from the DNA-curtain study11, it is possible that the dissociation of the Cas9–RNA complex was facilitated by the contacts with the AFM probe. On the basis of these HS-AFM data, we conclude that Cas9–RNA searches for the target sites by three-dimensional diffusion, rather than one-dimensional sliding, consistent with the DNA-curtain study11.
