Metal-Enhanced Immu... (二)
实验步骤
1. Preparation of Fluorescein-Doped PVA Films
The 0.5% PVA solution containing disodiumfluorescein was spin-coated on slide substrates at 3,000 rpm. The thickness of the sample obtained with this preparation was about 20 nm (24).
2. Preparation of SIFs and SACS
1) SIFs Preparation
SIFs-coated surfaces were formed by an incomplete silver mirror reaction as described earlier (25). Glass slides were cleaned by soaking in H2SO4 (98%) for 10–60 min and then were rinsed with Milli-Q water and dried on air before use. Slides were then coated with poly-l-lysine, with approximately 1.2 ml of the poly-l-lysine solution being added to each slide, incubated for 40–60 min and washed with water. Silver deposition was performed in a glass 100-ml beaker as follows. At intensive stirring, 20 drops of NaOH solution (5 M) were added to AgNO3 solution (500 mg) in Milli-Q water (60 ml), and dark brown precipitate formed immediately. Approximately 2 ml of 30% NH4OH solution was added to dissolve the precipitate (at continuous intense stirring), and the clear solution was cooled with ice to 10–15°C (10 min). A fresh glucose solution (720 mg d( )glucose in 15 ml Milli-Q water) was added to the mixture, and glass slides were immediately half-inserted into the mixture. Soaking of slides was performed for pairs of slides, so only one surface of each slide was exposed to the reaction mixture. Stirring of the mixture was continued in an ice bath for 2 min, and then ice was removed and the solution was stirred at warming (i.e., at medium heating) until 30°C for approximately 2 min. Then the heating was turned off, and the solution continued to be mixed intensively for an additional 3–4 min (the temperature increased to 35°C). After the color of the slides became greenish-brown and the solution became opaque, the slides were removed from the beaker and washed with water two times with sonication for approximately 25 s.
2) SACS Preparation
Prior to SACS preparation, silver colloids were made as previously described (22). Briefly, all necessary glassware were soaked in a base bath overnight and washed scrupulously with deionized water. The solution of 0.18 mg/ml silver nitrate (200 ml) was heated and stirred in a 250 ml Erlenmeyer flask at 95°C. The first 0.5-ml aliquot of 34 mM trisodium citrate solution was added dropwise. The solution was stirred for 20 min and warmed to 96–98°C. Then five aliquots (0.7 ml each) of 34 mM trisodium citrate were added dropwise to the reaction mixture every 15–20 min. Stirring was continued for 25 min until the milky yellow color remained. Then the mixture was cooled in an ice bath for 15 min. After that silver colloids were used to prepare SACS as described earlier (22). Briefly, slide surfaces were cleaned and drop coated with silver colloids. The slides were air-dried to form SACS. The dry slides with self-assembled nanoparticles were stored and used within a month.
3. Alexa488 Model Immunoassay
Model immunoassay was performed on the slide surface as described earlier (25). Briefly, mouse IgG was non-covalently immobilized on the sample slide, or rabbit IgG on the control slide. Slides were covered with 20 μg/ml IgG solutions in 50 mM Na-phosphate buffer (pH 7.3) and incubated at room temperature overnight. Next, slides were rinsed with water and covered with blocking solution for 2 h at room temperature. Then, after rinsing with water, AlexaFluor-488 labeled anti-mouse antibody conjugate (33 nM in blocking solution) was added to the sample slides (with mouse IgG) or control slides (with rabbit IgG) and after 1 h incubation and washing, slides were covered with 50 mM Na-phosphate buffer (pH 7.3) and the fluorescence signal was measured.
4. Atomic Force Microscopy
Atomic Force Microscopy (AFM) was performed on an Explorer Scanning Probe Microscope (ThermoMicroscopes). Scanning was acquired in contact mode with Non-Conductive Silicone Nitride cantilever T: 0.59–0.61 μm (Veeco; MSCT-EXMT-A). Image data was processed and analyzed on Veeco DI SPMLab software.
5. Photographs
The photographs, showing difference in intensity of Alexa488 signal on glass, SIF, and SACS, were taken with Canon 300D® digital SLR camera. The illumination source was Ti: Sapphire laser (Mai Tai, Newport Corp, Irvine CA) coupled with SCG-800 photonic crystal fiber (Newport Corp, Irvine CA) for supercontinuum generation. 470-nm band pass filter was used to select appropriate wavelength from the supercontinuum and the photographs were taken through 495 long-pass filter. For all the photographs, exposure time of one-fourth of a second and aperture of “14” was used. All images were cropped equally to one-fourth of the original image using ZoomBrowser® software (Canon Inc.).
6. Fluorescence Measurements
Fluorescence spectra and lifetimes were measured on FluoTime200 fluorometer (PicoQuant, GmbH). This instrument is equipped with a monochromator and a microchannel plate photomultiplier (MCP) detector on the observation path. With a 470-nm laser pulsed laser diode (pulse duration 68 ps) excitation, this fluorometer is capable of resolving sub-nanosecond intensity decays.
7. Microscopy Measurements
The Time-Correlated Single Photon Counting (TCSPC) MicroTime 200 confocal system (PicoQuant, GmbH., Berlin, Germany) coupled to Olympus IX71 microscope was used for measuring fluorescence enhancements. The fluorescence was excited with pulses from picosecond laser diode 470 nm (LDH-P-C-470B) worked at 20 MHz repetition rate and detected by Photon Avalanche Diode (SPAD) Perkin-Elmer (SPCM-AQR-14) detector. The fluorescence was observed confocally from the sample spin-coated on cover slips. Special, non-fluorescing cover slips were used (Menzel-Glasser #1). Sample was placed on the microscope stage, and light was focused (Olympus water immersion objective NA1.2, 60× magnification) in the sample plane. The observation path was equipped with three long-pass filters 500 nm to block excitation light and count fluorescence of the dye only. Photons were counted by TCSPC PicoHarp 300 board. The data was stored in the time-tagged time-resolved mode, which allowed the recording of every detected photon with its individual timing and detection channel information. All measurements and data analysis were performed using SymPho Time Software v. 5.0.
8. Interpretation of Measurements
1) Fluorescein-Doped PVA Films
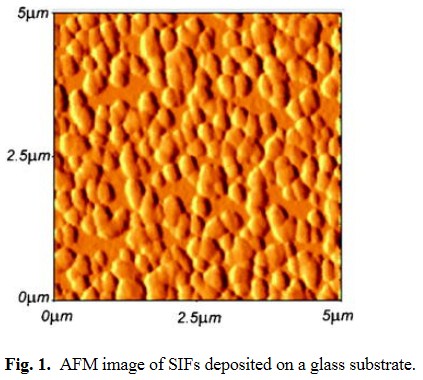
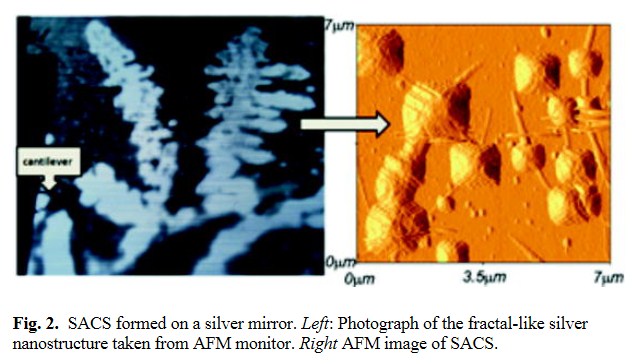
The magnitude of a fluorescence enhancement depends on the distance of fluorophores from the metallic surface as well as on a quantum yield of the probe. The strongest dependence, however, is on the metallic surface structure. The most popular and easy for the preparation are SIFs. Figure 1 shows typical SIFs deposited on a glass substrate evaluated by AFM. The surface is relatively homogeneous. The SACS prepared on a silver film show a different surface morphology (Fig. 2). The silver elongated nanoparticles form fractal-like structures (Fig. 2, left), making the metallic surface very heterogeneous. The expectation is to observe on these surfaces non-uniform enhancements, in contrast to glass and SIFs surfaces.


Emission spectra of fluorescein in PVA spin-coated on glass, SIFs, and SACS substrates are shown in Fig. 3. The spectrum on SACS is not only the strongest but also shifted towards longer wavelengths. Such shift is expected in very strong fields (26) and has been already observed (22). The comparison of the brightness between samples on glass, SIFs, and SACS are shown in the Fig. 4. The photographs were taken at the same excitation and observation conditions.


