数据库预测分析
Database Projection Analysis
Discover Prominent Factors in Chemical, Analytical & Biological Data
Brief Overview
In order to find prominent factors or differentiation within large databases of chemical, analytical (including spectra and chromatograms), and biological data, a researcher can use the loadings plot from a multivariate analysis of that data as a query to search against a "standard" dataset. However, depending upon the correlation of the experimental dataset to the standard dataset, this method does not always yield accurate answers. For example, in spectroscopic and chromatographic applications, inaccuracies are especially prevalent when the researcher uses a "peak-search" approach rather than using the whole spectrum or chromatogram in the database search.
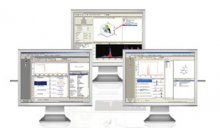
In response, Bio-Rad Laboratories, Inc. has introduced a new method known as Database Projection Analysis within the KnowItAll ® Informatics System. This method, which is complementary to other analytical approaches, can be quite successful in helping researchers to identify differentiation factors or "markers" hidden within a dataset.
How does it work?
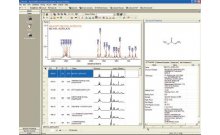
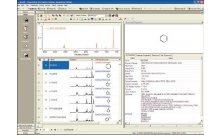
In Bio-Rad's KnowItAll Informatics System, the researcher imports the dataset and performs a multivariate analysis. Then, a standard (reference) dataset is "projected" on top of the results of the multivariate analysis. In the resulting database projection plot, the distance of a specific graphical point that represents a "known" record (from the standard database) to the origin indicates how much a particular record contributes to a classification/regression factor. The further away the point is from the origin, the more likely that this compound is to be a marker. This method of data analysis is useful in multiple applications, including the analysis of spectral and chromatographic data. For example, it can also be used for fast identification of biomarkers in metabolomics applications.


