


400-6699-117转1000
咨询列表
铂悦仪器(上海)有限公司
您好,欢迎您查看分析测试百科网,请问有什么帮助您的?

| 参考报价: | 面议 | 型号: | ELIO |
| 品牌: | 布鲁克 | 产地: | 德国 |
| 关注度: | 暂无 | 信息完整度: | |
| 样本: | 典型用户: | 暂无 |
400-6699-117转1000
布鲁克能散型XRFELIO可以用在多个行业领域,用来检测水蚤,可完成元素成份检测项目。符合多项行业标准ASTMB568。
Elemental composition of Daphnia
Daphnia are planktonic crustaceans and members of the order Cladocera. Because of their small size of 0.2 to 5 mm and their jumpy swimming style, Daphnia are commonly known as “water fleas”. Their aquatic living environment can range from rivers, streams, lakes and ponds to acidic swamps. Their short lifespan, their reproductive capabilities and especially their sensitivity to contaminants make them an indicator species in the field of environmental toxicology.Daphnia are for instance used to test the effects of toxins on ecosystems. Because Daphnia are almost transparent,their internal organs are easy to examine in live specimens.
The performed examination demonstrates the capabilities of μ-XRF as a method for the analysis of these biological species regarding elemental composition and the possibility to use it also for environmental control.
The samples
A single Daphnia is shown in figure 1. The size of the water flea is less than 3 mm. The photo shows the thin, partly transparent body and the head with a large eye. The body is protected by a thin and transparent carapace. The most prominent features are the eyes, the second antennae and a pair of abdominal setae.
Measurements were performed on two samples. One of them was fed with nano-particles which were tagged with Au(sample 2). The samples were prepared on a quartz support that gives a relatively high spectral background due to scattering and a Si fluorescence signal.
Instrumentation
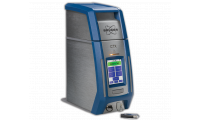
The measurements were performed with a Bruker M4 TORNADO. This μ-XRF spectrometer is characterisedby the following features:
Large and evacuable sample chamber of 600x350x260 mm (WxDxH)
Fast X-Y-Z-stage with TurboSpeed for fast mappings and distribution analysis on-the-fly
Effective excitation of fluorescence by high brilliance X-Ray tube together with X-Ray optics for concentrationof tube radiation to spot sizes down to 25 μm
Detection of fluorescence radiation with Silicon-Drift-Detectors (SDD) with high count rate capability
Quantification with standardless models using full pattern fitting.
Measurement conditions
The samples were measured with the following excitation conditions: 50 kV, 600 μA. Measurements were performed in vacuum for the first sample and in air for the second sample.
The vacuum measurement was performed with 10 ms per pixel and air measurement with 500 ms. This long time allows the detection even of small element concentrations.
Scanned area for both samples was approx. 3 x 3.5 mm.The map size was 150 x 180 pixels which results in a pixel distance of approx. 20 μm. The total measurement time for mapping was approx. 5 min and 3.8 h, respectively.
Measurement results
The distribution of main elements for the first Daphnia (no gold) is shown in figure 2.
The sum spectrum of the mapping of the first sample is displayed in figure 3. This spectrum shows that the main constituent is Ca.
High intensities are also detected for Si (from the quartz support) and from Rh (scattered tube radiation). These intensities can only be detected with measurements under vacuum.
Small intensities are detected for heavier elements like Ti and Fe. The distributions of all detected elements are displayed as single maps in figure 4. It can be seen that the main structure of the carapace is formed by Ca and K. The distribution of P and S are very similar.
In comparison to that the distribution of Fe and Ti are clearly concentrated in the alimentary tract. There is a possibility that by the filtering of water suspended sediments from soil with a high content of Fe and Ti minerals are collected in the intestine.
The next measurement was performed on the Daphnia that was fed with the nano-particles tagged with Au. In that case measurement time was increased to 500 ms,
which results in a significantly longer total measurement time of approx. 3.8 h but also in a higher spatial resolution due to better statistics and a higher sensitivity for traces.The normalised sum spectra of both measurements (10 ms and 500 ms measurement time per pixel) are displayed in figure 5.
It can be seen that the measurement in vacuum shows the expected significantly higher intensity for Si. Due to the absorption of that radiation in air the intensity in the according measurement is reduced. This is also valid for P and S. For the heavier elements the differences are not so significant. The longer measurement time of the second measurement allows the detection of trace elements like Au and Zn. For Au this was expected due to the special preparation of the samples. The elemental distribution measured for this sample is displayed in figure 6.
The distribution for this sample looks slightly differrent because the water flea is analysed in another position. But still the structure of the carapace consisting of Ca and the outer shell containing K, P and S can be identified. The structure is more detailed and appears smoother due to the longer measurement time.
The Fe distribution in the alimentary tract can be detected again. Due to the changed position of the sample the position of this tract is changed, too. Additionally Au can be detected apart from Fe. The Au intensity is significantly less than for Fe but the distributions are very similar i.e. the Au seems to be in the alimentary tract as well. This can be expected if the water flea has filtered the water containing Au-nano-particles.
The concentration of Au in these areas is relatively high as it can be seen in the spectra in figure 7. One of these spectra is from a single point (blue), the other is the sum spectrum from a larger area (red). The sum spectrum was generated using the HyperMap functionality of the M4 TORNADO software. HyperMap offers the possibility to sum up spectra from several measurement points to obtain a spectrum with good statistics that can even be used for quantification.
Conclusions
μ -XRF offers the possibility to examine the elemental distribution in biological samples. Even the distribution of light elements down to Na can be detected in case of measurement in vacuum.
The high excitation intensity and the large captured solid angle of fluorescence radiation results in the high count rates obtained with the M4 TORNADO. Measurements with the M4 TORNADO guarantee the improvement of spatial resolution and allow the detection of smallest traces.
4、ELIO基于激发强度大,样品台可以快速移动的设计,从而检测速度fei常快,此外,控制软件还可进一步优化采集时间
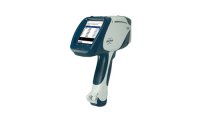
5、采用先进CUBE技术的大面积硅漂移探测器(SDD)
6、采用先进的探测器技术,能量分辨率<140eV(Mn Kα),并具有高输出计数率(OCR),可实现快速分析,同时保持高能量分辨率
7、高电压50 kV的X射线激发源与近距离检测的几何结构,可在数秒内实现非接触式检测
8、灵活更换X射线管阳,滤波片和准直器,为不同领域的应用提供更加优化的检测条件。
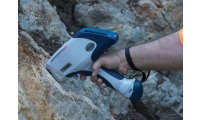
携带便携
1、测量头安装在紧凑轻量的铝质三脚架上,使ELIO fei常适合移动使用
2、测量头的总重量为2.1千克
3、样本大小如何,三脚架上的ELIO都可以轻松地对其元素进行检测
4、多种三脚架可供选择,满足不同的用户要求
5、可选的电动XY平台,完成现场便携式的元素分布绘图

6、文物遗产研究---ELIO可以对考古研究,艺术
鉴定和保护的物体进行原位扫描,使用户免于必运输,避免样品收到损害。
一、地质科学
分析大型钻芯部分或其他矿物样品,拥有先进的元素分布图和光谱解析功能,可帮助科学家了解岩土材料中元素含量以及分布信息。
二、材料科学
针对一些先进材料,可以通过移动扫描获得元素分布,从而扩展了这些材料的应用,从空间科学走向消费产品。
三、食品科学
植物中的元素分布图可以准确识别营养物富集的位置,直观地展示加工食品中强化剂的分布。
四、科学教育和研究
可作为教学和研究工具来分析田野,教室或实验室中的物体和材料。

ELIO是一款紧凑式的便携式能量色散X射线荧光光谱仪,针对一些珍贵的材质,可进行非接触式和无损性的元素分析。ELIO利用CUBE技术可获得准确的元素分布图,实现测量点的准确定位,拥有直观的硬件和分析软件,加快了XRF分析仪器的现代化进程。
在微区-XRF中设置标准
方便快捷的非接触式检测
1、ELIO设计简单精美,具有1毫米的激光定位分析点,内置相机和新型电子元件
2、测量头安装在带有两个电动平台的三脚架上,完成元素分布图的采集
3、设计狭窄的鼻部能够进入测量点和难以到达的紧角完成检测
ELIO 能量色散X射线荧光光谱仪 能散型XRF 可检测水蚤信息由铂悦仪器(上海)有限公司为您提供,如您想了解更多关于ELIO 能量色散X射线荧光光谱仪 能散型XRF 可检测水蚤报价、型号、参数等信息,欢迎来电或留言咨询。
注:该产品未在中华人民共和国食品药品监督管理部门申请医疗器械注册和备案,不可用于临床诊断或治疗等相关用途