铂悦仪器(上海)有限公司
分析测试百科网 认证会员,请放心拨打!

微区X射线荧光光谱仪检测水蚤元素成份
| 样品: | 水蚤 | 项目: | 元素成份检测 |
| 参考: | ASTMB568 |
下载地址: 微区X射线荧光光谱仪检测水蚤元素成份
Elemental composition of Daphnia
Daphnia are planktonic crustaceans and members of the order Cladocera. Because of their small size of 0.2 to 5 mm and their jumpy swimming style, Daphnia are commonly known as “water fleas”. Their aquatic living environment can range from rivers, streams, lakes and ponds to acidic swamps. Their short lifespan, their reproductive capabilities and especially their sensitivity to contaminants make them an indicator species in the field of environmental toxicology.Daphnia are for instance used to test the effects of toxins on ecosystems. Because Daphnia are almost transparent,their internal organs are easy to examine in live specimens.
The performed examination demonstrates the capabilities of μ-XRF as a method for the analysis of these biological species regarding elemental composition and the possibility to use it also for environmental control.
The samples
A single Daphnia is shown in figure 1. The size of the water flea is less than 3 mm. The photo shows the thin, partly transparent body and the head with a large eye. The body is protected by a thin and transparent carapace. The most prominent features are the eyes, the second antennae and a pair of abdominal setae.
Measurements were performed on two samples. One of them was fed with nano-particles which were tagged with Au(sample 2). The samples were prepared on a quartz support that gives a relatively high spectral background due to scattering and a Si fluorescence signal.
Instrumentation
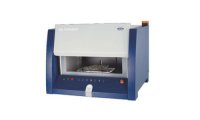
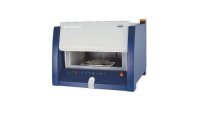
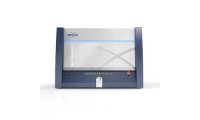
The measurements were performed with a Bruker M4 TORNADO. This μ-XRF spectrometer is characterisedby the following features:
Large and evacuable sample chamber of 600x350x260 mm (WxDxH)
Fast X-Y-Z-stage with TurboSpeed for fast mappings and distribution analysis on-the-fly
Effective excitation of fluorescence by high brilliance X-Ray tube together with X-Ray optics for concentrationof tube radiation to spot sizes down to 25 μm
Detection of fluorescence radiation with Silicon-Drift-Detectors (SDD) with high count rate capability
Quantification with standardless models using full pattern fitting.
Measurement conditions
The samples were measured with the following excitation conditions: 50 kV, 600 μA. Measurements were performed in vacuum for the first sample and in air for the second sample.
The vacuum measurement was performed with 10 ms per pixel and air measurement with 500 ms. This long time allows the detection even of small element concentrations.
Scanned area for both samples was approx. 3 x 3.5 mm.The map size was 150 x 180 pixels which results in a pixel distance of approx. 20 μm. The total measurement time for mapping was approx. 5 min and 3.8 h, respectively.
Measurement results
The distribution of main elements for the first Daphnia (no gold) is shown in figure 2.
The sum spectrum of the mapping of the first sample is displayed in figure 3. This spectrum shows that the main constituent is Ca.
High intensities are also detected for Si (from the quartz support) and from Rh (scattered tube radiation). These intensities can only be detected with measurements under vacuum.
Small intensities are detected for heavier elements like Ti and Fe. The distributions of all detected elements are displayed as single maps in figure 4. It can be seen that the main structure of the carapace is formed by Ca and K. The distribution of P and S are very similar.
In comparison to that the distribution of Fe and Ti are clearly concentrated in the alimentary tract. There is a possibility that by the filtering of water suspended sediments from soil with a high content of Fe and Ti minerals are collected in the intestine.
The next measurement was performed on the Daphnia that was fed with the nano-particles tagged with Au. In that case measurement time was increased to 500 ms,
which results in a significantly longer total measurement time of approx. 3.8 h but also in a higher spatial resolution due to better statistics and a higher sensitivity for traces.The normalised sum spectra of both measurements (10 ms and 500 ms measurement time per pixel) are displayed in figure 5.
It can be seen that the measurement in vacuum shows the expected significantly higher intensity for Si. Due to the absorption of that radiation in air the intensity in the according measurement is reduced. This is also valid for P and S. For the heavier elements the differences are not so significant. The longer measurement time of the second measurement allows the detection of trace elements like Au and Zn. For Au this was expected due to the special preparation of the samples. The elemental distribution measured for this sample is displayed in figure 6.
The distribution for this sample looks slightly differrent because the water flea is analysed in another position. But still the structure of the carapace consisting of Ca and the outer shell containing K, P and S can be identified. The structure is more detailed and appears smoother due to the longer measurement time.
The Fe distribution in the alimentary tract can be detected again. Due to the changed position of the sample the position of this tract is changed, too. Additionally Au can be detected apart from Fe. The Au intensity is significantly less than for Fe but the distributions are very similar i.e. the Au seems to be in the alimentary tract as well. This can be expected if the water flea has filtered the water containing Au-nano-particles.
The concentration of Au in these areas is relatively high as it can be seen in the spectra in figure 7. One of these spectra is from a single point (blue), the other is the sum spectrum from a larger area (red). The sum spectrum was generated using the HyperMap functionality of the M4 TORNADO software. HyperMap offers the possibility to sum up spectra from several measurement points to obtain a spectrum with good statistics that can even be used for quantification.
Conclusions
μ -XRF offers the possibility to examine the elemental distribution in biological samples. Even the distribution of light elements down to Na can be detected in case of measurement in vacuum.
The high excitation intensity and the large captured solid angle of fluorescence radiation results in the high count rates obtained with the M4 TORNADO. Measurements with the M4 TORNADO guarantee the improvement of spatial resolution and allow the detection of smallest traces.