

400-6699-117转4994
咨询列表
上海昊量光电设备有限公司
您好,欢迎您查看分析测试百科网,请问有什么帮助您的?
分析测试百科网 认证会员,请放心拨打!

| 参考报价: | 面议 | 型号: | Raman_micro_Imaging_system |
| 品牌: | Photon etc. | 产地: | 加拿大 |
| 关注度: | 527 | 信息完整度: | |
| 样本: | 典型用户: | 暂无 | |
| 仪器类型 | 地面 | 价格范围 | 30万-50万 |
| 工作原理 | 其它 | 成像方式 | 二元光学元件 |
| 空间分辨率(IFOV) | 346q | 成像分辨率 | 356 |
| 光谱范围 | 345 | 使用状态 | 67 |
| 视场(TFOV) | 57 | 光谱分辨率 | 689 |
| 成像方式 | 6 | 工作原理 | 46 |
| 帧频 | 57 |
诚信认证:
工商注册信息已核实! 扫一扫即可访问手机展台
400-6699-117转4994
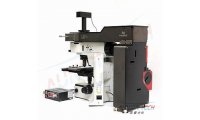
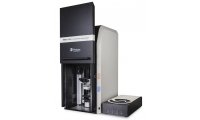
RIMA激光拉曼显微成像系统
RIMA拉曼显微高光谱成像系统
Photon etc公司RIMA拉曼成像技术是新一代快速、高精度、面扫描激光拉曼技术,它将共聚焦显微技术与激光拉曼光谱技术完美结合,与传统的点成像拉曼系统不同,采用面成像技术,将激光扩束后,用特殊的光学元件将扩束后的高斯分布的激光整形成均匀分布的平顶激光,照射在样品上,滤除反射的激光后,所有激发的拉曼光和再通过可调滤波器为主的高光谱成像组件,成像在ccd上,可在几分钟内完成,以相元为单位,可以形成高达十万组拉曼光谱数据。是目前市面上zei快的拉曼成像设备.
1. 快速global mapping(非扫描式)
2. 百万像素拉曼光谱,成像时间仅几分钟
3. 斯托克斯和反斯托克斯
4. 高光谱分辨率和空间分辨率
拉曼成像系统,,激光拉曼成像光谱仪, 拉曼光谱仪,拉曼成像高光谱,激光拉曼高光谱成像系统,激光拉曼高光谱成像仪,RAMAN imagingsystem,RAMAN spectrometer,RAMAN spectral system

Photon etc公司RIMA拉曼成像技术是新一代快速、高精度、面扫描激光拉曼技术,它将共聚焦显微技术与激光拉曼光谱技术完美结合,与传统的点成像拉曼系统不同,采用面成像技术,将激光扩束后,用特殊的光学元件将扩束后的高斯分布的激光整形成均匀分布的平顶激光,照射在样品上,滤除反射的激光后,所有激发的拉曼光和再通过可调滤波器为主的高光谱成像组件,成像在ccd上,可在几分钟内完成,以相元为单位,可以形成高达十万组拉曼光谱数据。是目前市面上zei快的拉曼成像设备。
产品特点
1. 快速global mapping(非扫描式)
2. 百万像素拉曼光谱,成像时间仅几分钟
3. 斯托克斯和反斯托克斯
4. 高光谱分辨率和空间分辨率
设备原理图:

系统参数:
拉曼光谱测量范围 | 100 — 4000 cm-1 |
光谱分辨率 | < 6 cm-1(取决于激光器波长) |
空间分辨率 | Sub-micron |
显微镜 | Inverted |
物镜 | 20x, 60x, 100x |
相机 | Back-illuminated CCD camera, sCMOS或EMCCD |
扫描速度 | 250 µm2/min at full spectral range |
波长准确度 | 1 cm-1 |
激发波长 | 473nm, 532nm, 660nm, 785nm或者其他波长 |
应用领域:
单层石墨烯鉴别
 Graphene, one of the most popular allotropes of carbon, has sparked broad interest in the field of material science since it was first isolated in 2004 by Professors Geim and Novoselov (University of Manchester). Curren tly, the synthesis of large-scale graphene on copper surfaces by chemical vapor deposition (CVD) is being explored by the scientific community. Despite considerable efforts, CVD graphene in different growth conditions exhibits various morphologies such as the presence of hillocks, defects, grain boundaries and multilayer island formation, effects which researchers are attempting to mitigate. But to be able toexhaustively study the composition of these samples, hyperspectral Raman imaging was required, and was carried out on CVD monolayer graphene with bilayer islands. Raman spectroscopy is a non-destructive analysis method that provides microscopic structural information by comparing a sample’s spectrum with reference spectra. Here, we present selected results from Prof. Martel’s group at Université de Montréal obtained during the investigation of the formation of graphene multilayer islands during Chemical Vapor Deposition growth with methane as feedstock. Known Raman signatures of the different configurations of graphene were used in this study to map the number of layers of the samples.
Raman imaging was performed with the hyperspectral Raman imaging platform RIMA™ based on Bragg tunable filter technology. In these measurements, a CW laser at λ = 532 nm illuminated 130 × 130 μm2 and 260 × 260 μm2 sample surface areas through 100X and 50X microscope objectives respectively. In this configuration, the sample was excited with 120 μW/μm2 and 30 μW/μm2 and the resolution was diffraction limited.
FIG. 1 (a) presents a 130 × 130 μm2 Raman map of graphene’s G band (∼1590 cm-1) in three different families: monolayer graphene (blue), bilayer graphene in resonance (red) and bilayer graphene out of resonance (green). Their typical associated Raman spectra are presented in FIG. 1 (b-c). The intensity variations of the G band reveal information on the stacking of the layers. The most significant changes in intensity observed in FIG. 1 (b) can be explained by resonance resulting from the twisted angle (13.5° at λexc = 532 nm [1]) of the bilayer graphene. FIG. 1 (d-f) presents similar results as in FIG. 1 (a-c), but data were acquired from a larger area: 260 × 260 μm2. The intrinsic specificity of Raman scattering combined with global imaging capabilities allows users to assess large maps (hundreds of microns) of defects, number of layers and stacking order, etc.
纳米材料分析

Global Raman imaging is an exceptional technique for the analysis of large surfaces of thin films and advanced materials. Its rapidity makes it a great tool not only for universities and research institutes, but also for industrial laboratories. With no or minimal sample preparation, RIMA™, Photon etc.’s new hyperspectral Raman imager, can easily take part in routine analysis, where the prompt access to information about sample composition is crucial for the development of new materials.
With systems based on point-to-point or scanning technologies, the acquisition of maps of large areas is often tedious and time consuming: the analysis of a sample may take hours. RIMA™ expedites in minutes the acquisition of the whole area in the field of view, rendering full maps of a sample with unmatched rapidity. In fact, the hyperspectral cube is built image by image, along the spectral window of interest, with a spectral resolution better than 7 cm-1. Since a spectrum is recorded for each pixel, it is possible, with a 1024 x 1024 pixels camera, to collect more than one million spectra without moving the sample. Moreover, the size of the maps can be as large as 650 x 650 mm2, depending on the magnification of the objective used for the analysis. Photon etc.’s filters used for hyperspectral imaging are based on holographic gratings, and provide very high efficiency for an optimal acquisition of the weak Raman scattering. Combined with top of the line low noise CCD or EMCCD cameras, RIMA™ is the most efficient Raman imaging system on the market.
In order to show the advantages of RIMA™ in the analysis of nanomaterials in biological systems, carbon nanotubes (CNT) have been incubated with a sample of Candida Albicans yeast cells and exposed to a homogeneous (flat-top) laser excitation of 532 nm on the entire field of view. With a 50X objective, an area of 260 x 130 μm2 was imaged, with a step of 4.5 cm-1 and an exposition time of 15 s. The complete analysis took 20 minutes, for a total of more than 60,000 spectra.
Figure 1 shows the Raman hyperspectral cube of a portion of the imaged area containing the yeast. The monochromatic Raman images revealed the position of the aggregated yeast cells stained with the CNTs. The typical signal of CNTs (red line) confirmed their presence on the yeast cells, while in other areas the hyperspectral camera did not detect any CNT Raman signal (blue line).
Raman Multiplexing
 DEVELOPMENT AND CHARACTERIZATION OF CARBON NANOTUBE BASED RAMAN NANOPROBES BY RAMAN HYPERSPECTRAL IMAGING: MULTIPLEXING AND BIODETECTION
The potential of Photon etc. Raman Imaging Platform, RIMA™, was demonstrated by Pr. R Martel’s group at Université de Montréal in a recent publication in Nature Photonics on the development of Raman nanoprobes [1].
These new kind of nanoprobes are based on single-wall carbon nanotubes and J-aggregated dyes, such as α−sexithiophene (6T), β-carotene (βcar) and phenazine (Ph). Compared to fluorescent probes, Raman probes have the advantages of being more stable over long periods of times (weeks and years) and they produce a unique signature with narrow peaks that allows easy multiplexing of 3 probes or more using the same excitation laser energy. This nanomaterial shows a very high Raman scattering cross-section, without any photobleaching or fluorescence background, even at high laser intensities.
In this work RIMA™ enabled the imaging and multiplexing of three different probes with sensitivity down to the single object as seen in Figure 1. The different probes were deposited on a SiOx/Si surface and characterized by taking a single hyperspectral image. We were able to determine, without a doubt, the position of each isolated probe (diameters: 1.3 ± 0.2 nm), and even identify the co-localized probes (Fig 1b, Ph and βcar). The sensitivity, efficiency and hyperspectral properties of RIMA™ were essential to the development of these probes.
The carbon nanotube, which serves as a capsule for the probe, can be covalently functionalized to selectively target biomolecules, such as streptavidin. We demonstrated RIMA™’s potential in the detection of probes in a biological context by imaging the βcar probe functionalized with PEG-biotin groups that targeted streptavidin.
A pattern of 10 μm spots of streptavidin was created by microcontact printing and then incubated with the probes. The pattern was maintained hydrated under a cover slip during imaging and the probes were detected where streptavidin was located. Figure 2 shows Raman hyperspectral images at 1520 cm-1 of two printed surfaces, where streptavidin was deposited either inside (main figure) or around the dots (inset). With a single acquisition, a sample area of 133 x 133 μm2 was studied using RIMA™ with laser excitation at 532 nm. Damages to the samples were also limited due to a uniform illumination over the portion of the sample in the field of view. In terms of spectral resolution and large surface area imaged, RIMA™ provided hyperspectral images in a much shorter time then conventional point-by-point mapping Raman imagers.
Raman hyperspectral imaging is a powerful technique to study a wide range of materials, from nanopatterned surfaces to biological systems. Because of its high throughput, RIMA™ allows the acquisition of spectrally resolved maps of large area samples, without damaging the surface.
相关产品


超高速显微拉曼成像光谱仪信息由上海昊量光电设备有限公司为您提供,如您想了解更多关于超高速显微拉曼成像光谱仪报价、型号、参数等信息,欢迎来电或留言咨询。
注:该产品未在中华人民共和国食品药品监督管理部门申请医疗器械注册和备案,不可用于临床诊断或治疗等相关用途