Basics of Electrochemical Impedance Spectroscopy(六)
Purely Capacitive Coating
A metal covered with an undamaged coating generally has a very high impedance. The equivalent circuit for such a situation is in Figure 11.

Figure 11. Purely Capacitive Coating
The model includes a resistor (due primarily to the electrolyte) and the coating capacitance in series.
A Nyquist Plot for this model is shown in Figure 12. In making this plot, the following values were assigned:
R = 500 Ω | (a bit high but realistic for a poorly conductive solution) |
C = 200 pF | (realistic for a 1 cm2 sample, a 25 μm coating, and εr = 6) |
Fi = 0.1 Hz | (lowest frequency is a bit higher than typical) |
Ff = 1 MHz | (highest frequency at the EIS software limit) |
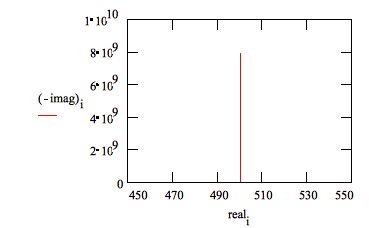
Figure 12. Typical Nyquist Plot for an Excellent Coating
The value of the capacitance cannot be determined from the Nyquist Plot. It can be determined by a curve fit or from an examination of the data points. Notice that the intercept of the curve with the real axis gives an estimate of the solution resistance.
The same data are shown in a Bode Plot in Figure 13. Notice that the capacitance can be estimated from the graph but the solution resistance value does not appear on the chart. Even at 100 kHz, the impedance of the coating is higher than the solution resistance.
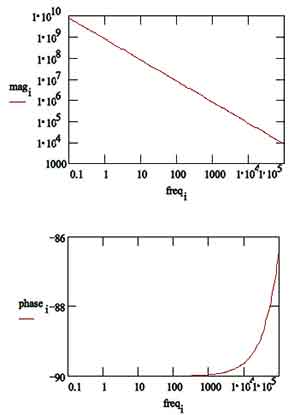
Figure 13. Typical Bode Plot for an Excellent Coating
Water uptake into the film is usually a fairly slow process. It can be measured by taking EIS spectra at set time intervals. An increase in the film capacitance can be attributed to water uptake.
Simplified Randles Cell
The Simplified Randles cell is one of most common cell models. It includes a solution resistance, a double layer capacitor and a charge transfer (or polarization resistance). The double-layer capacitance is in parallel with the charge-transfer resistance. In addition to being a useful model in its own right, the Simplified Randles Cell is the starting point for other more complex models.
The equivalent circuit for a Simplified Randles Cell is shown in Figure 14.
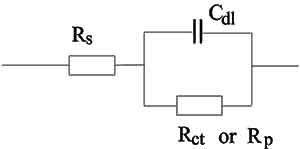
Figure 14. Simplified Randles Cell Schematic Diagram
Figure 15 is the Nyquist Plot for a typical Simplified Randles cell. The parameters in this plot were calculated assuming a 1 cm2 electrode undergoing uniform corrosion at a rate of 1 mm/year. Reasonable assumptions were made for the Tafel coefficients, metal density and equivalent weight. The polarization resistance under these conditions was calculated to be 250 Ω. A capacitance of 40 μF/cm2 and a solution resistance of 20 Ω were also assumed.
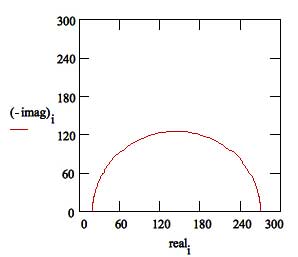
Figure 15. Nyquist Plot for 1 mm/year Corrosion Rate
The Nyquist Plot for a Simplified Randles cell is always a semicircle. The solution resistance can found by reading the real axis value at the high frequency intercept. This is the intercept near the origin of the plot. Remember this plot was generated assuming that Rs = 20 Ω and Rp = 250 Ω
The real axis value at the other (low frequency) intercept is the sum of the polarization resistance and the solution resistance. The diameter of the semicircle is therefore equal to the polarization resistance (in this case 250 Ω).
Figure 16 is the Bode Plot for the same cell.
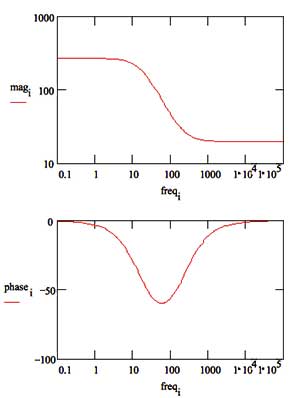
Figure 16. Bode Plot for 1 mm/year Corrosion Rate


