Vector measurement and performance tuning of a terahertz bottle beam-2
According to ref.4, the radius of the sharpest THz light ring can be expressed as
(1)
where α and n is the base angle and the refractive index of the Teflon axicon, f is the focal length of the silicon lens. Herein, these parameters are α = 20°, n = 1.42618, f = 8 mm, respectively. The calculated R equals 1.29 mm, which is generally in agreement with the measured value. In addition, in the interior of the THz bottle beam, the longitudinal distance of the central dark region along the z direction can be evaluated as
(2)
where z0 is the distance between the Teflon axicon and the silicon lens,
is the diffraction-free range of the THz Bessel beam formed by the Teflon axicon, ω0 is the radius of the incoming THz beam. Herein, these parameters are z0 = 35 mm, ω0 = 7 mm, Zmax = 43 mm. The measured and calculated Δz are 6.0 mm and 6.30 mm, which are basically consistent with each other. Here, when the forward and backward optical barriers on the negative and positive positions of the z axis reach the same intensities as the THz light ring on the focal plane, the distance between them is defined as the longitudinal distance Δz of the THz bottle beam.
To simulate these measured phenomena, the vectorial diffraction integral algorithm of a focusing optical system is adopted under the Debye approximation19. Close to the focal spot, the vector electric field of the converging THz beam can be described as
(3)
where λ is the wavelength of the incoming THz wave, k is the wave number in vacuum, β is the maximum convergence angle of the THz beam after the silicon lens,
are the cylindrical coordinates of the focal area,
has the following expression
(4)
where ix, iy, and iz are the polarization functions for x-, y- and z-components on the entrance pupil of the silicon lens. On the incidence plane of the silicon lens, the THz field refracted by the Teflon axicon forms an x-linearly polarized Bessel beam, so ix, iy, and iz can be written as20
(5)
(6)
(7)
where
are the polar coordinates on the entrance pupil of the silicon lens and
can be written as
(8)
(9)
Figure 2c shows the simulated amplitude distributions of Ex at z = −4.5 mm, 0 mm, 4.5 mm for the THz bottle beam, which are consistent with the measured phenomena. On the longitudinal cross-section, the simulated THz amplitude pattern is also extracted, as shown in Fig. 2d. The simulated result exactly presents the evolution of the THz bottle beam as the experimental one. To further check the accuracy of the simulated result, the measured and calculated amplitude curves at z = −4.5 mm, 0 mm, 4.5 mm are extracted from Fig. 2b,d. Three white dashed lines are inserted into Fig. 2b,d to indicate their positions. Figure 2e–g exhibit the comparison of the measured and calculated results, which show that the maximum divergence does not exceed 15%.
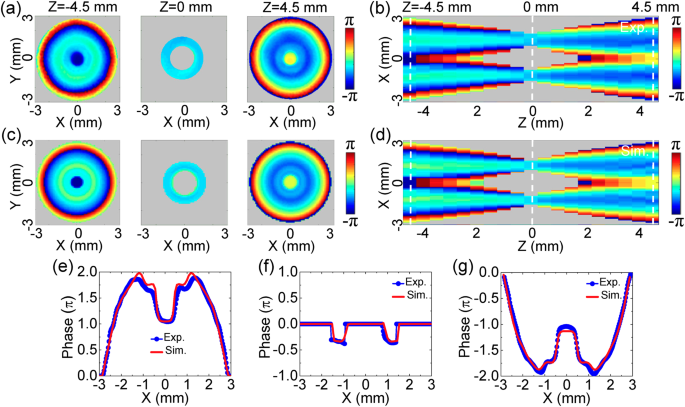
Because the THz field is coherently detected by the imaging system, the THz phase information can be directly obtained. To more intuitively observe the features of the THz bottle beam, the wrapped phase patterns of Ex with 0.75 THz at z = −4.5 mm, 0 mm, 4.5 mm are acquired, as shown in Fig. 3a. Here, the color of a pixel is set as gray and the corresponding phase value is fixed as 0 when the amplitude is less than 10% of the maximum value on the pixel. The aim of the operation is to filter the phase noise on each phase image. Obviously, all of the three phase patterns present axial symmetric distributions, because both of the Teflon axicon and the silicon lens induce axial symmetric phase modulations. At z = −4.5 mm, the phase pattern shows a convex shape from ρ = 0.27 mm to 3.0 mm. Meanwhile, the phase pattern exhibits a concave shape along the radial direction at z = 4.5 mm. At z = 0 mm, the phase value remains almost invariable near the annular region of ρ = 1.23 mm. For clarity, the phase curves along the lines of y = 0 mm are extracted from the three phase images and are unwrapped, as shown in Fig. 3e–g. These phenomena manifest that the THz Bessel beam induced by the Teflon axicon undergoes converging and diverging processes to ultimately form the THz bottle beam after passing through the silicon lens. Figure 3b shows the longitudinal cross-section of the Ex wrapped phase, which more vividly presents the propagation process of the THz beam. It can be said that the Bessel-like THz field is due to the interference effect of converging THz beams at z = −4.5 mm or diverging THz beams at z = 4.5 mm, respectively4. At z = 0 mm, the ring-shaped THz field is composed by a series of focal spots of converging THz beams. According to ref.21, the annular THz intensity can be considered as the Fourier transformation of the THz Bessel beam. By utilizing Eqs (3–9), the phase pattern of Ex is also simulated for the THz bottle beam. Figure 3c shows the simulated wrapped phase images at z = −4.5 mm, 0 mm, 4.5 mm and Fig. 3d gives the corresponding longitudinal phase cross-section, which are in accordance with the measured phenomena. The calculated unwrapped phase curves at z = −4.5 mm, 0 mm 4.5 mm are also extracted along the lines of y = 0 mm from Fig. 3c and are compared with the measured results, as shown in Fig. 3e–g. The measured and calculated results are in accordance with each other. The positions of the measured and calculated phase curves are also indicated by the three white dashed lines in Fig. 3b,d. It can be seen that the formation origin of the THz optical barrier can be easily understand by analyzing the complex field information of the THz bottle beam.
Phase pattern of Ex with 0.75 THz for the linearly polarized THz bottle beam. (a) Transverse wrapped phase images of Ex at z = −4.5 mm, 0 mm, 4.5 mm. (b) Longitudinal wrapped phase cross-section of Ex. (c,d) Show the simulated transverse and longitudinal phase patterns. (e–g) show
the measured and calculated unwrapped phase curves along the x axis at
z = −4.5 mm, 0 mm, 4.5 mm. Three white dashed lines in (b,d) indicate their positions.