基于epMotion 5075t系统与KPPA HyperPlus试剂盒的全自动测序...2
Results and Discussion
The post-ligation qPCR results were used to calculate the percentage of starting material that was successfully adapter ligated, or the conversion rate as shown in Figure 3. Higher conversion rates are generally achieved with higher input amounts into library preparation, which results in libraries with greater complexity. With lower input amounts, a larger proportion of material may be lost to DNA adsorption to plas tic surfaces, which can contribute to decreased conversion rates. For inputs above 100 ng, conversion rates typically range between 50 – 100%. For inputs between 10 ng – 100 ng, conversion rates range between 10 – 50%. For inputs 1 – 10 ng, conversion rates range between 5 – 20%. Across all replicates, each input exceeded the expected conversion rates. The high conversion rates indicate that the Eppendorf LoBind® quality consumables (PCR plates, tubes) may improve sample recovery yields throughout the library construction process.

Figure 3: Post-Ligation Yields and Conversion Rates. All input amounts resulted in higher conversion rates than typically observed in manual experiments. 1 ng inputs had an average conversion rate of 28.86% compared to 5 – 20% typical conversion rates. 10 ng inputs and 50 ng inputs had average conversion rates of 96.81% and 170.91%, respectively, compared to 10 – 50% typical conversion rates. 200 ng inputs had an average conversion rate of 178.54% compared to 50 – 100% typical conversion rates. Conversion rates above 100% can be explained by highly ef cient adapter ligation with little to no sample loss during the post-ligation cleanup. The addition of the ~140 bp adapters to the DNA fragments increases the overall molecular weight of the samples. If most of the DNA fragments were adapter-ligated and carried through the post-ligation cleanup, then the net yield can be higher than the initial input concentration.
The post-size selection qPCR results were used to calculate the
percentage of material retained from the post-ligation cleanup as shown
in Figure 4. Typically, 5 – 20% of material is retained from size
selection. Across all inputs, the size selection retention fell within
the expected range.

Figure 4: Post-Size Selection Yields and Percentage Retained from Post-Ligation material. Following the 0.6× – 0.8× size selection, all input amounts resulted in 10 – 17% retention from the post-ligation cleanup, which falls within the expected range of 5 – 20%
The post-amplif cation qPCR results were used to calculate the amplif
cation ef ciency as shown in Figure 5. Library amplif cation ef ciency
is typically ≥ 80%, but can vary depending on the quality of sample and
number of PCR cycles. With the chosen PCR cycling parameters, both the 1
ng and 10 ng input samples had an average amplif cation ef ciency
greater than 80%. The 50 ng and 100 ng input samples had an average
amplif cation ef ciency of approximately 74%, still being within the
normal range. The number of PCR cycles should be optimized according to
the requirements for downstream processes.

Figure 5: Post-Amplif cation Yields and Amplif cation Effi ciency. The number of PCR cycles varied across input amounts to achieve f nal library yields between
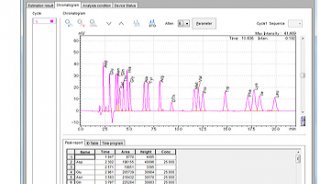
The Agilent 2100 BioAnalyzer was used to determine the fnal library size
distributions shown in Figure 6. The 0.6× – 0.8× size selection was
expected to retain fragments between 250 – 450 bp. Across all inputs,
the average fnal library sizes were between 305 – 330 bp, with narrow
and reproducible size distributions. The absence of adapter-dimer (~140
bp) and large fragments (> 450 bp) shows the size selection process
to be highly effective.
 |
 |
 |
 |
Figure 6: Electrophoretic Size Analysis of Final Libraries across all inputs. Size analysis of all 16 replicates was performed. The average size of the 1 ng (top left) and 10 ng inputs (top right) were 305 bp +/- 8 bp and 317 bp +/- 1 bp, respectively. The average size of the 50 ng (bottom left) and 200 ng inputs (bottom right) were 330 bp +/- 5 bp and 330 bp +/- 7 bp, respectively. Within all replicates, the average size varied by less than 8%, which shows that size selection was highly robust.
Conclusion
NGS library construction is a critical step in sample prepa ration for sequencing on Illumina platforms. The increased demand for high-quality NGS libraries in high-throughput laboratories has necessitated the development of robust, automated methods for library preparation. Kapa Biosystems, an industry leader in NGS library preparation, has partnered with Eppendorf to automate the KAPA HyperPlus Kit on the Eppendorf epMotion 5075t. The experimental data shows that the automated method performs within the KAPA HyperPlus Kit specifcations at a wide range of input amounts from 1 ng – 200 ng. The highly flexible and modular automated solution for NGS library preparation will allow laboratories to easily scale up experi ments without sacrifcing quality in the process.

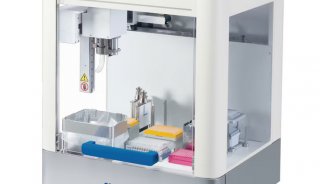
Figure 7: Eppendorf epMotion 5075t Deck Layout. This fgure shows the fully walk-away setup for fragmentation, end repair, A-tailing, adapter ligation and bead-based purifcation steps before the library amplifcation.
  |