Real-space and real-time dynamics of CRISPR-Cas9 visualized by ...(四)
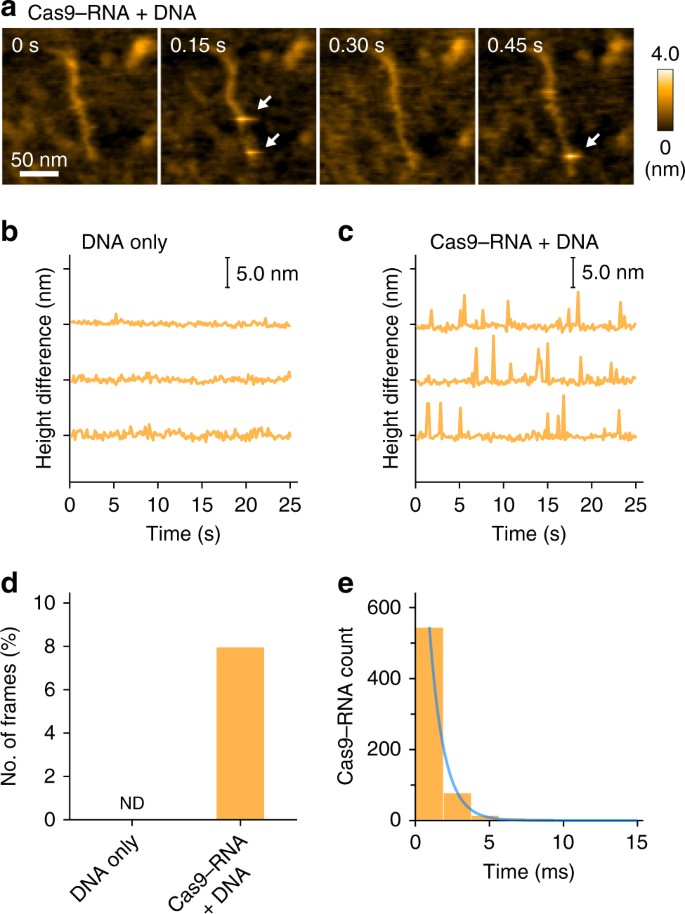
HS-AFM observations of the non-specific transient binding of Cas9–RNA. a Sequential HS-AFM images of Cas9–RNA molecules transiently bound to non-target sites of the DNA. Transient binding of Cas9–RNA appears as a bright spot in the images, as indicated by the white arrows. Most of the binding events were completed within a single-line scanning time (1.9 ms; 150 ms / 80 lines). The scale bar is 50 nm. b, c Differences between the lowest and highest heights in each image during the HS-AFM observations of DNA only (b) and Cas9–RNA–DNA (c). In c, the spikes indicate the transient binding of Cas9–RNA to the DNA. d, e Frequency (d) and lifetime (e) of the transient binding of Cas9–RNA to the DNA. The lifetime was estimated by counting the successive line numbers on which the spike-like spots were continuously seen. Spike-like spots with heights over 3.5 nm were judged as Cas9–RNA molecules. The lifetime was fitted by the 1st order exponential decay, with a time constant of 0.98 ± 0.02 ms (n = 656)
Discussion
HS-AFM enables the direct visualization of the structures and dynamics of intact molecules, in contrast to other single-molecule imaging methods, in which a molecule of interest must be labeled with fluorescent probes. Using HS-AFM, we visualized the real-space and real-time dynamics of CRISPR-Cas9 in action, thereby improving our mechanistic understanding of the RNA-guided DNA cleavage by Cas9. Although our HS-AFM data are essentially consistent with previous fluorescence-based imaging studies11,17,18, there are some discrepancies between these studies. For example, a recent single-molecule FRET study reported that the majority (90%) of Cas9–RNA stably adopt the D state upon DNA binding, while only 3% of the complexes undergo transitions between the I and D states18. In contrast, our HS-AFM data showed that most of the Cas9–RNA complexes fluctuate between the I and D states after DNA binding. This discrepancy is likely due to the differences in the imaging techniques and experimental conditions. On the basis of our HS-AFM data, together with previous structural, biochemical and biophysical data11,12,13,14,15,16,17,18,28, we propose a model for the Cas9–RNA-mediated DNA cleavage (Fig. 7a–c). Apo-Cas9 adopts a flexible modular architecture, and assembles with the guide RNA to form the stable Cas9–RNA effector complex. The Cas9–RNA complex interrogates the target sites on the DNA via three-dimensional diffusion, and recognizes the complementary target site with the NGG PAM. Cas9–RNA then unwinds the dsDNA target to form the R-loop. The HNH domain undergoes conformational fluctuations upon R-loop formation, and then adopts the catalytically-active docked conformation to cleave the target strand, while the RuvC domain cleaves the non-target strand. Overall, this study provides unprecedented details about the functional dynamics of CRISPR-Cas9, and highlights the potential of HS-AFM to elucidate the action mechanisms of RNA-guided effector nucleases from distinct CRISPR-Cas systems29.
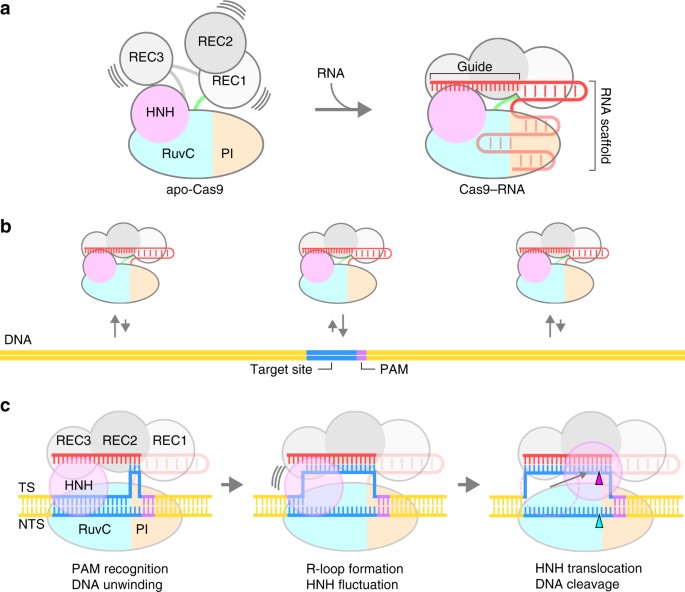
Model of CRISPR-Cas9 action. a Assembly of the Cas9–RNA binary complex. b Target DNA interrogation by Cas9–RNA via three-dimensional diffusion. c DNA recognition and cleavage by Cas9–RNA. DNA cleavages by the RuvC and HNH domains are indicated by the cyan and magenta triangles, respectively
Methods
Sample preparation
Wild-type S. pyogenes Cas9 and GFP-dCas9(D10A/C81L/C574E/H840A) were expressed in Escherichia coli Rosetta2 (DE3), and then purified to homogeneity by column chromatography, as described with minor modifications15. Briefly, the Cas9 protein was expressed in E. coli Rosetta2 (DE3) (Novagen), and was purified by chromatography on Ni-NTA Superflow (QIAGEN), HiTrap SP HP (GE Healthcare), and HiLoad Superdex 200 16/60 (GE Healthcare) columns. The 98-nt guide RNA was transcribed in vitro, and then purified by denaturing urea polyacrylamide gel electrophoresis, as described15. The 600-bp target DNA was PCR-amplified using the pUC119 plasmid containing the 20-nt target sequence and the TGG PAM30 as the template, and then purified using a Wizard DNA Clean-Up System (Promega). The sequences of Cas9, the guide RNA and the target DNA are provided in Supplementary Data 1.
HS-AFM observations on an AP-mica surface
The laboratory-built high-speed AFM was used in the tapping mode31. The cantilever deflection was detected with an optical beam deflection detector, on which a 0.7 mW, 780 nm infrared laser was mounted. The infrared laser beam was focused onto the back side of the cantilever (Olympus: BL-AC7DS-KU4) through a ×60 objective lens (Nikon: CFI S Plan Fluor ELWD 60×). The reflected laser from the cantilever was detected with a two-segmented PIN photodiode. The spring constant of the cantilever was ~100 pN nm−1. The resonant frequency and the quality factor of the cantilever in liquid were ~800 kHz and ~2, respectively. An amorphous carbon tip was fabricated on the original AFM tip by electron beam deposition (EBD). The length of the additional AFM tip was ~500 nm, and the radius of the apex of the tip was ~4 nm. The free oscillation amplitude of the cantilever was ~1 nm and the set-point amplitude was set to 90% of the free amplitude. For HS-AFM observations of Cas9, a mica surface was treated for 3 min with 0.011% (3-aminopropyl)triethoxysilane (APTES) (Sigma-Aldrich). The complex of Cas9, RNA and DNA was pre-assembled (Cas9:RNA:DNA = 1:1:1 mole ratio) in AFM-imaging buffer. HS-AFM observations of apo-Cas9 and Cas9–RNA were performed in buffer, consisting of 20 mM Tris-HCl, pH 8.0, 100 mM KCl and 0.01 mM EDTA. HS-AFM observations of the Cas9–RNA–DNA and GFP-dCas9–RNA–DNA complexes were performed in buffer, consisting of 20 mM Tris-HCl, pH 8.0, 30 mM KCl and 0.01 mM EDTA. All HS-AFM experiments were performed at room temperature.
HS-AFM observations on a lipid bilayer
The DNA was loosely immobilized on a mica-supported lipid bilayer31. In brief, 1,2-dipalmitoyl-sn-glycero-3-phosphocholine (DPPC; Avanti Polar Lipids) and 1,2-dipalmitoyl-3-trimethylammonium-propane (DPTAP; Avanti Polar Lipids) were suspended in chloroform, and 1,2-dipalmitoyl-sn-glycero-3-phosphoethanolamine-N-(cap biotinyl) (biotin-cap-DPPE; Avanti Polar Lipids) was suspended in a mixture of chloroform:methanol:water = 65:35:8 (volume ratio). The lipid solutions were mixed at a weight ratio of DPPC:DPTAP:biotin-cap-DPPE = 90:5:5. Small unilamellar vesicles (SUVs) of the lipid mixture, at 0.2 mg ml−1 in 10 mM MgCl2, were prepared by sonication for 1 min, using a bus-sonicator (AS ONE). A mica disk (1.0 mm in diameter) glued on the sample stage of the HS-AFM was freshly cleaved, and the mica-supported lipid bilayer was formed on it by depositing 2 μl of the SUVs solution for 3 min, followed by 1 μl of 20 mM Tris-HCl, pH 8.8, for over 10 min. The sample surface was rinsed with drops of Milli-Q water (20 μl × 5) to remove the excess SUVs, and then the solution was replaced with buffer A (20 mM Tris-HCl, pH 8.0, 30 mM KCl, 0.01 mM EDTA). DNA (2 μl, 1 ng μl−1) in buffer A was deposited on the surface for 3 min. After rinsing the surface with buffer B (20 mM Tris-HCl, pH 8.0, 30 mM KCl, 2 mM MgCl2), the sample stage was immersed in a liquid cell filled with buffer B (~55 μl), and HS-AFM observations were performed. During the HS-AFM observations, a drop (~5 μl) of either apo-Cas9 or Cas9–RNA (molar ratio of Cas9:RNA = 1:2) was added to the liquid cell, at a final concentration of ~80 nM.