Fate Mapping Axolotl Embryos in Early Gastrulation
Background
Since different amphibians execute gastrulation in different ways, the study of amphibian gastrulation has been complex. A popular method used to examine and explore gastrulation and determine the future fate of cells in amphibian embryos is the visualization of cell movement by application of a vital (non-toxic) dye to the region of interest on the amphibian embryo. This process of observing morphogenetic cell movements with vital dye and correlating wuth developmental fate is known as fate mapping (Gilbert, 2000 and Hamburger 1960).
In 1929, Walter Vogt, an embryologist, used vital dyes to construct fate maps of amphibian embryos. He spread and dried dye and agar on a microscope plate and cut the ends of the dyed agar to apply to desired regions of the embryo. He placed the small vital dye chips on the surface of amphibian embryos at various stages of development to study the movements and fates of various regions of the embryo. Vogt's fate mapping studies at the gastrula stage introduced embryologists to a very useful method of determining which portions of the embryo become which larval or adult structures and to modern investigations of amphibian gastrulation (Hardin, 1995).
Objective
Cells of the amphibian blastula have different fates depending on the position of the cells (dorsal-ventral, anterior-posterior, left-right) and how deep they are in the layers of the embryo (Gilbert, 2000), We will observe the movement of a population of cells to see what thieir developmental fate is by dying the embryos superficial regions at two different positions with respect to the blastopore lip (figure 1).
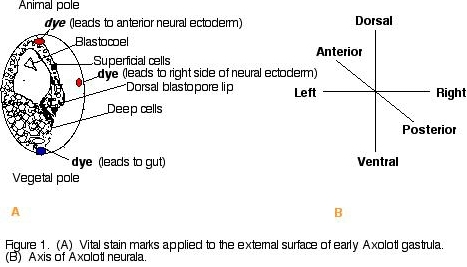
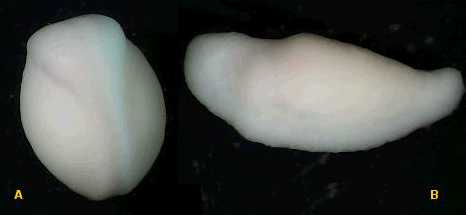
Procedure 1) Wash albino Axolotl amphibian gastrulae in a dish filled with 100% HEPES-buffered Modified Steinberg's Solution (HBSt). Using albino Axolotl's will make it easier to track the dye. 2) Place embryos in 10% HBSt and remove jelly coat using using fine forceps. 3) Transport embryos and 10% HBSt to black agarose dish for contrast. 4) Apply a nile blue sulfate dye chip to one end (animal pole or vegetal pole) of the gastrulae and a neutral red dye chip to the other end of the gastrulae (animal pole or vegetal pole) (figure 1). Replace 10% Steinberg's solution with fresh 10% HBSt. 5) Observe gastrulae in microscope and take a picture on day one of experiment. Take a picture each day for the next few days to observe the movement of the dyed cells of the gastrulae. (Note: To delay growth, place gastrulae at 14oC). Results and Conclusions Dye was applied to opposite ends of 6 Axolotl embryos (figure 2). Over a three day period, the elongation of the stained material was noted. The embryo just below the green star (figure 2) was dyed at opposite ends (left and right) of the blastopore. A dye-marked embryo similar to the star-marked embryo (figure 2) would be expected to give rise to the left and right side of the neural ectoderm (figure 3). Looking down on the day 2 dye-marked embryo, the blue and red dye appear as longitudinal stripes on opposite sides. The blue dye can be seen on the right side of the neural ectoderm and red dye on the left side of the neural ectoderm (figure 3a). The day 3 neurula, which is lying on its left side (which would be expected to contain red dye on the neural ectoderm), shows the blue dye on the right side of the neural ectoderm (figure 3b). It was noted that with time, it became harder to sustain the movement of the dye-marked populations of cells, where the dye became lighter and much more difficult to trace. Also, some embryos became sick and died. In the future, it would be a good idea to dye more embryos and possibly even take photos more frequently (i.e., twice a day). Figure 2. Dye marked Axolotl embryos on day one. The embryo just below the star was dyed on the left and right side of the blastopore lip. That population of cells would be expected to follow the pathway through the left and right neural ectoderm shown below (figure 3). Figure 3. (A) dye-marked embryo on day 2 showing a blue longitudeal stipe on the right side of the embryo and a red longitudal stripe on the right side of the embryo. The dyed region is on the left and the right side of the neural ectoderm. (B) day 3 dye marked neurula lying on its left side. The population of cells containing the blue dye can be seen along the right neural ectoderm of the neurula. Acknowledgements I would like to thank the Franklin and Marshall biology department for allowing me to conduct the experiment in their laboratory facilities and for the availability of their laboratory supplies. Another special thank you to my lab partners Matthews Banda and John DeLong for their assistance in dying the embryos. I would especially like to thank professor Cebra-Thomas, my developmental biology professor, for her assistnace in conducting the experiment and interpreting the results of the experiment.